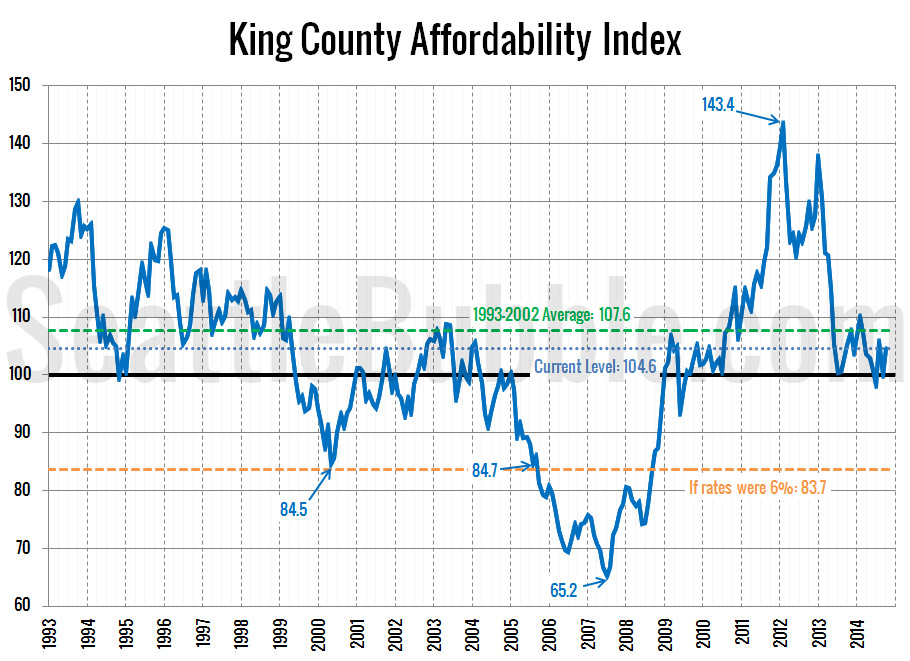
Let’s take a look at how affordability is doing in the Seattle area after the last few months of changes in home prices and interest rates. So how does affordability look as of October? With home prices stagnating this fall and interest rates inching back down close to 4 percent, the affordability index moved back…
Search Results for: calculator
Another Bubble? Affordability Only Sustained By Low Rates
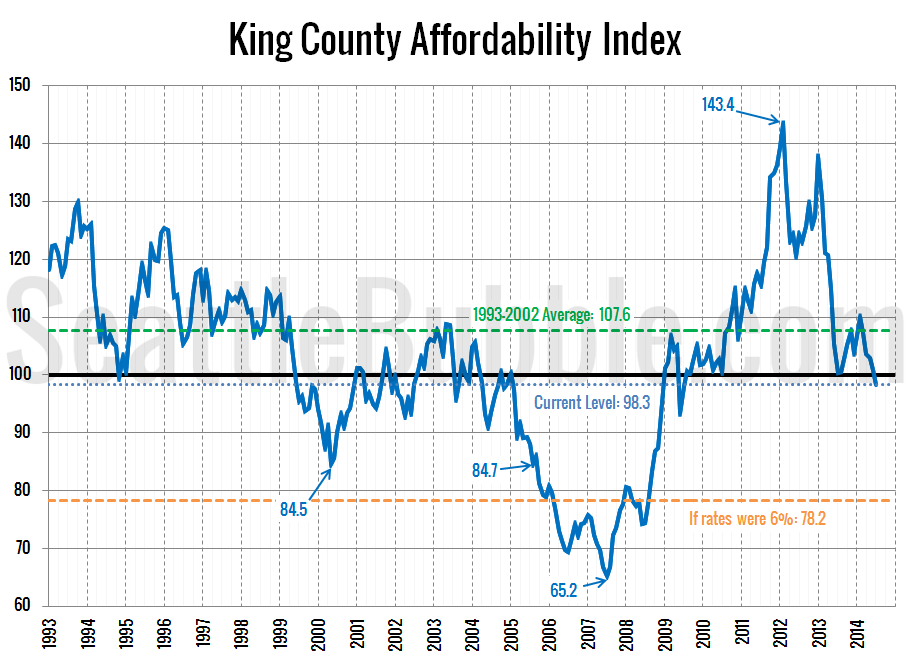
Continuing our “Another Bubble?” series, it’s time to take a look at the affordability index. As King County’s median home price has surged from $405,400 in February to $468,000 in July, the affordability index has dropped from slightly above the long-term average to just below 100. An index level above 100 indicates that the monthly…
Low Rates Keep Seattle Homes Almost Affordable
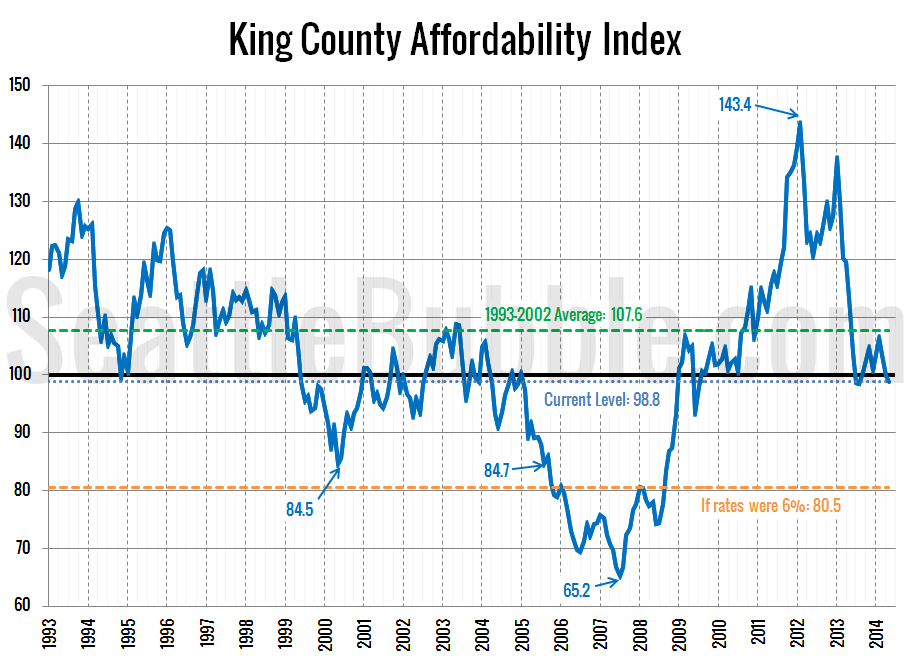
Let’s take a look at how affordability is doing in the Seattle area after the last couple months of changes in home prices and interest rates. So how does affordability look as of May? Thanks to the spring surge in home prices, we’ve dropped back below the “affordable” level of 100. The index sits at…
New, Even Better New York Times Buy vs. Rent Calculator
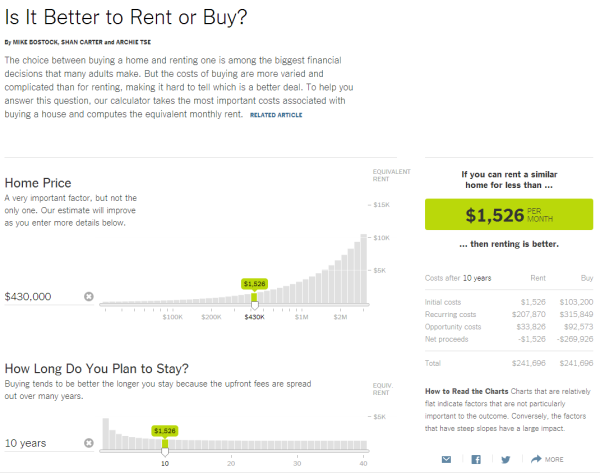
For years, the gold standard in online buy vs. rent calculators has been the one created and hosted by the New York Times. This week, they released a brand new, updated and enhanced version: Is It Better to Rent or Buy? The new version lays out all of the variables in a clean and simple…
Affordability At Pre-Bubble Average Level
Let’s take a look at how affordability is doing in the Seattle area after the last couple months of changes in home prices and interest rates. So how does affordability look as of March? Basically on par with the long-term pre-bubble average. The index sits at 103.5, basically the same as January. An index level…


