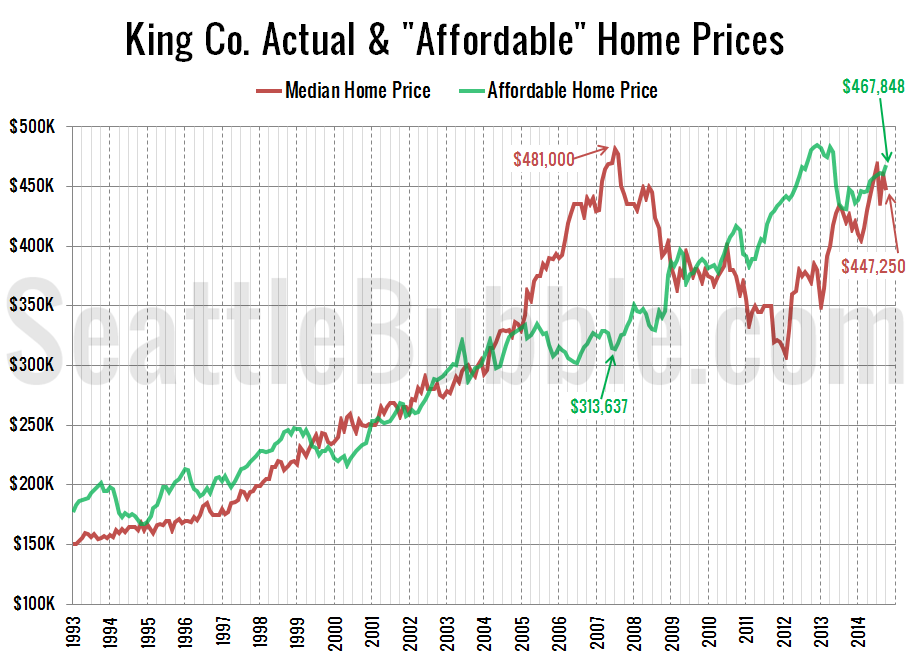
As promised in yesterday’s affordability post, here’s an updated look at the “affordable home” price chart. In this graph I flip the variables in the affordability index calculation around to other sides of the equation to calculate what price home the a family earning the median household income could afford to buy at today’s mortgage…
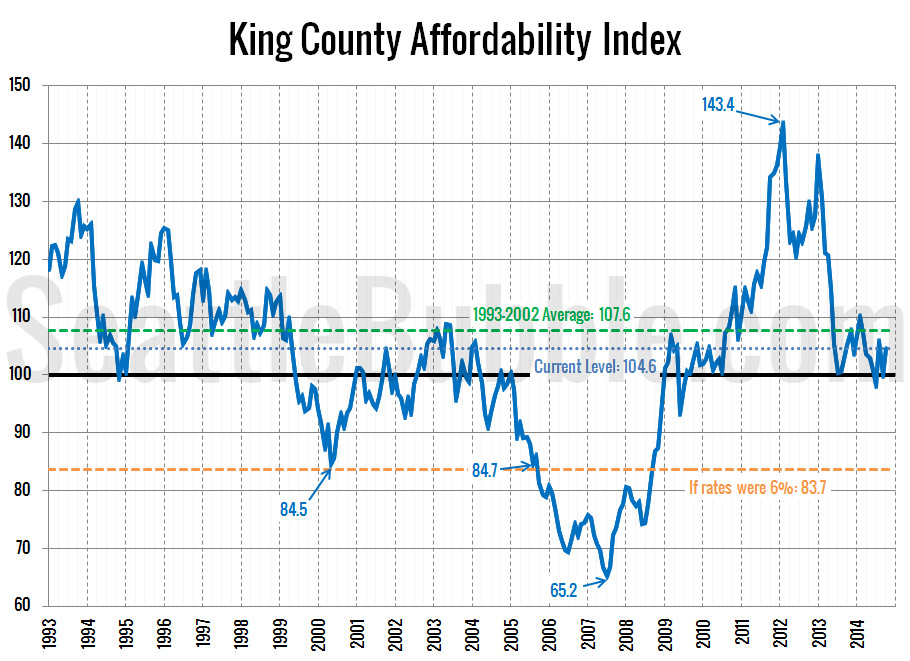
Affordability Index Bounces Back Above 100
Let’s take a look at how affordability is doing in the Seattle area after the last few months of changes in home prices and interest rates. So how does affordability look as of October? With home prices stagnating this fall and interest rates inching back down close to 4 percent, the affordability index moved back…
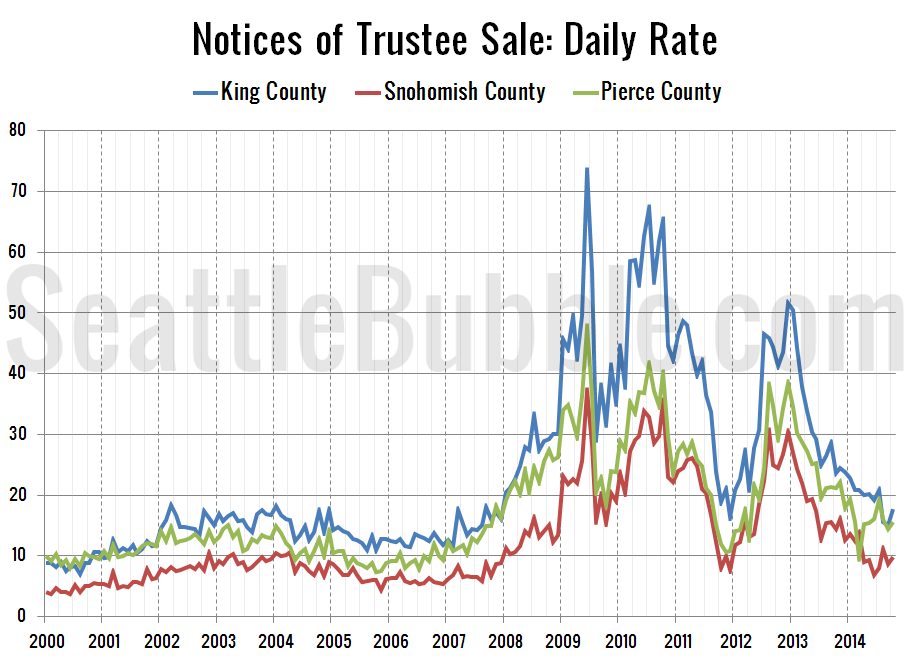
Foreclosures Up Slightly September to October
It’s a bit past time for our detailed look at October foreclosure stats in King, Snohomish, and Pierce counties. First up, the Notice of Trustee Sale summary: October 2014 King: 389 NTS, down 25% YOY Snohomish: 216 NTS, down 32% YOY Pierce: 343 NTS, down 26% YOY The number of trustee sale notices was down…
Poll: How many trees would there be on your ideal home lot?
This poll was active 11.16.2014 through 11.22.2014
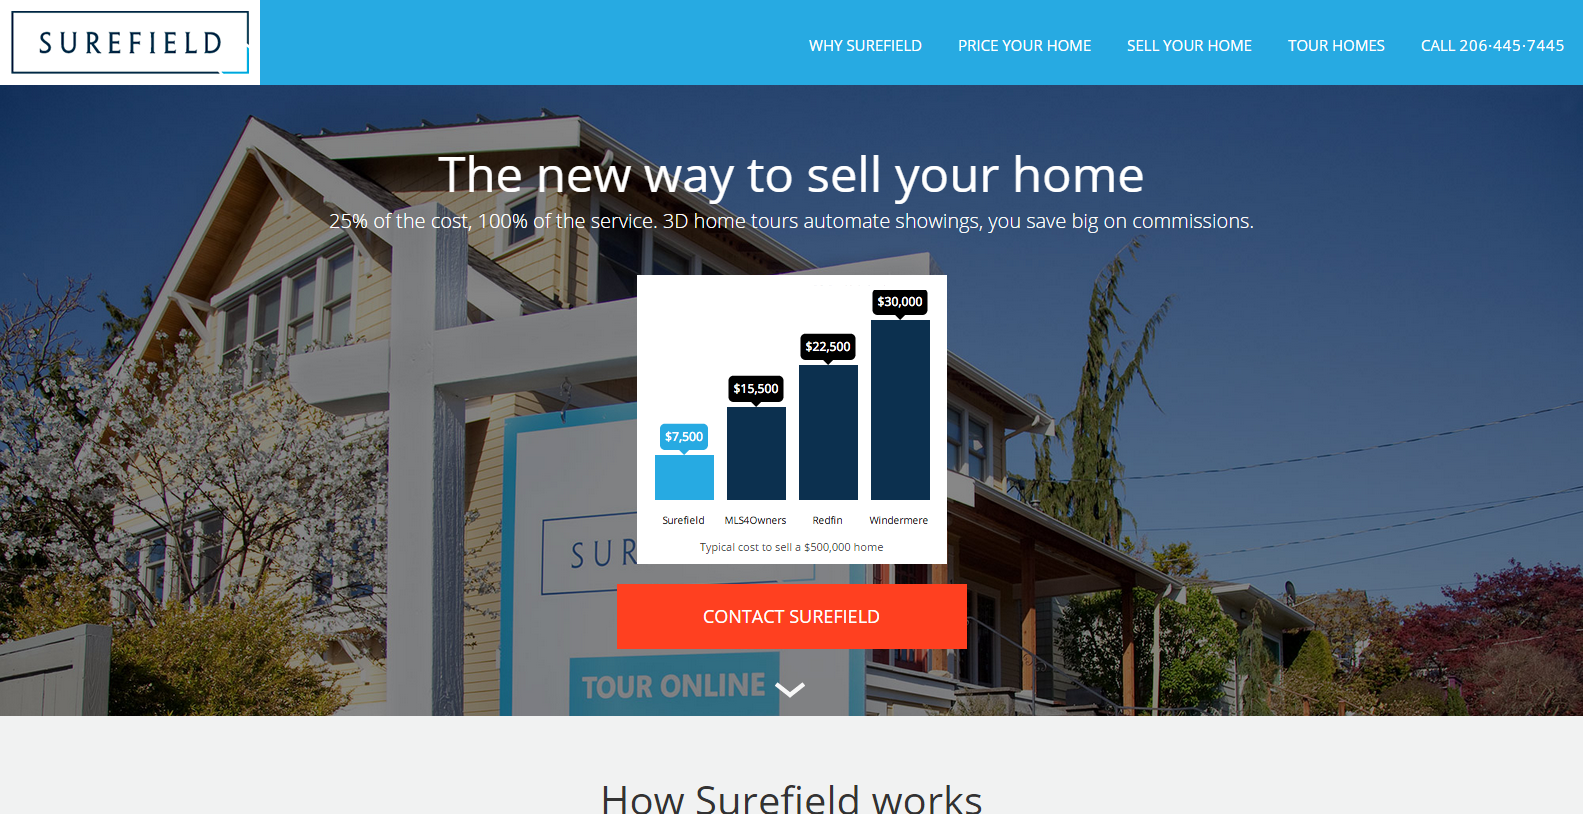
Surefield Expands from 3D Tours in Attack on Commissions
Surefield, the local 3D home tour brokerage launched in April by a pair of Redfin veterans and a former Nvidea tech wizard, is expanding their mission to attack buyer’s agent commissions… from the seller’s side. Here’s an excerpt from their press release: Surefield is dramatically lowering buy-side commissions to bring the U.S. residential real estate…


