Skip to content

Seattle Bubble

local real estate news, statistics, and commentary without the sales spin.

Menu
  • Home
  • About
  • Contact
  • Reference
  • Speaking
Menu

Foreclosures Dipped Again in September

Posted on October 20, 2014October 20, 2014 by The Tim

It’s a bit past time for our detailed look at August foreclosure stats in King, Snohomish, and Pierce counties. First up, the Notice of Trustee Sale summary: September 2014 King: 317 NTS, down 44% YOY Snohomish: 182 NTS, down 41% YOY Pierce: 301 NTS, down 29% YOY As usual, the number of trustee sale notices…

Share:

  • Twitter
  • LinkedIn
  • Facebook
  • Reddit
  • Pinterest
  • Email

Poll: Microsoft’s influence on the Seattle area overall has been:

Posted on October 19, 2014October 26, 2014 by The Tim

This poll was active 10.19.2014 through 10.25.2014

Share:

  • Twitter
  • LinkedIn
  • Facebook
  • Reddit
  • Pinterest
  • Email

Vote For Us in KING5’s “Best of Western Washington”

Posted on October 17, 2014October 17, 2014 by The Tim

Find us on the Best of Western WashingtonSeattle Bubble It’s that time of the year again. If you follow other local news sites and personalities, you may have seen some of them campaigning for votes in KING5’s annual Best of Western Washington, an online contest in which the public votes on “the best” local businesses,…

Share:

  • Twitter
  • LinkedIn
  • Facebook
  • Reddit
  • Pinterest
  • Email

Consumer Confidence Dipped in September

Posted on October 16, 2014September 26, 2018 by The Tim

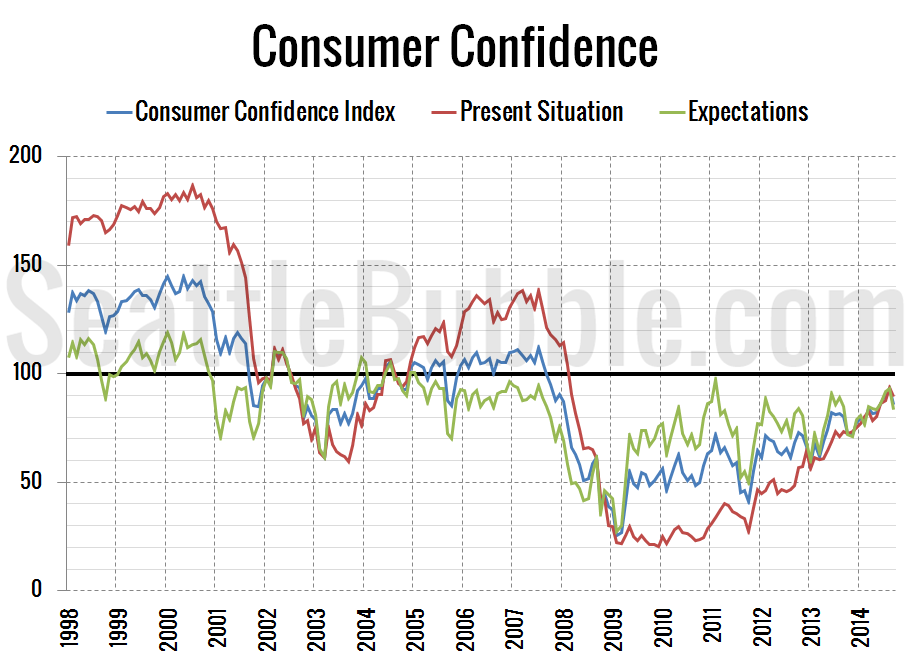
This is a couple weeks late, but let’s check in on how Consumer Confidence and mortgage interest rates fared during September. First up, here’s the Consumer Confidence data as of September: The overall Consumer Confidence Index currently sits at 86.0, down 8 percent in a month but up 7 percent from a year ago. At…

Share:

  • Twitter
  • LinkedIn
  • Facebook
  • Reddit
  • Pinterest
  • Email

More Pending Sales Closed in Q3, One in Five Still MIA

Posted on October 14, 2014October 14, 2014 by The Tim

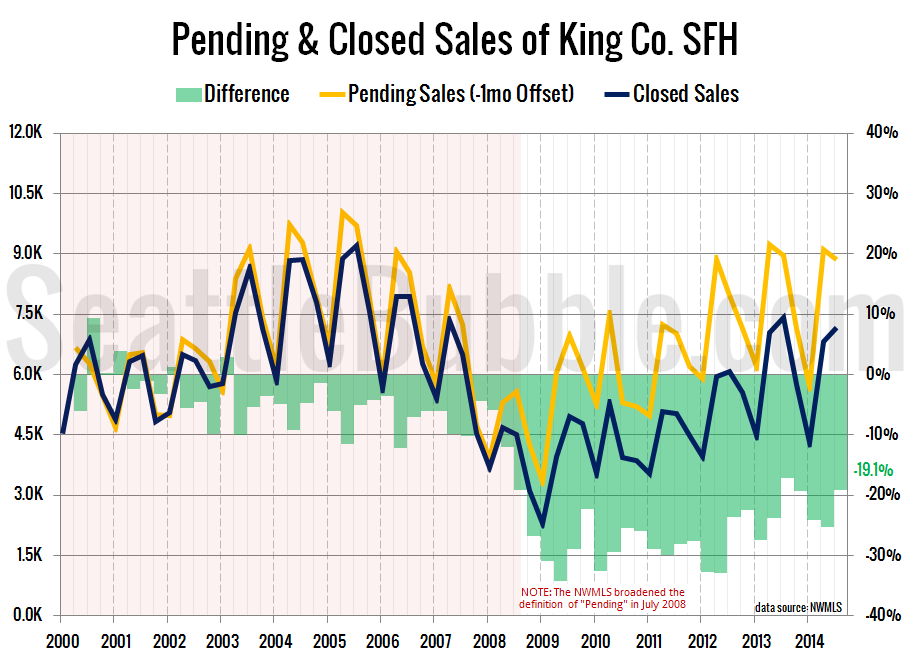
Let’s take a look a the latest data on pending sales volume versus closed sales volume. For this series I roll the pending sales and closed sales data up by quarter, with pending sales offset by one month. In other words, the third quarter numbers below represent pending sales from June, July, and August and…

Share:

  • Twitter
  • LinkedIn
  • Facebook
  • Reddit
  • Pinterest
  • Email

Posts navigation

  • Previous
  • 1
  • …
  • 70
  • 71
  • 72
  • 73
  • 74
  • 75
  • 76
  • …
  • 717
  • Next

Tim’s Other Projects

Dispatches from the Multiverse

Current Market Stats

Charts courtesy Altos Research
Real Estate Market Chart by Altos Research www.altosresearch.com

Real Estate Market Chart by Altos Research www.altosresearch.com

Real Estate Market Chart by Altos Research www.altosresearch.com

Real Estate Market Chart by Altos Research www.altosresearch.com

News Categories

  • News (1,253)
    • Local (223)
    • National (46)
    • International (1)
    • Audio & Video (60)
    • Humor (43)
    • Opinion (88)
    • Uncategorized (314)
  • Features (558)
  • Statistics (1,109)
    • Counties (724)
    • Neighborhoods (100)
  • Economy (74)
  • Extras (491)
    • Polls (381)
    • Flickr Group (1)
    • Announcements (38)
    • Administrative (78)

Archives

Tip Jar

Like what we're doing?

Drop us a tip!

Accounts

  • Log in
  • Entries feed
  • Comments feed
  • WordPress.org
©2024 Seattle Bubble | Built using WordPress and Responsive Blogily theme by Superb