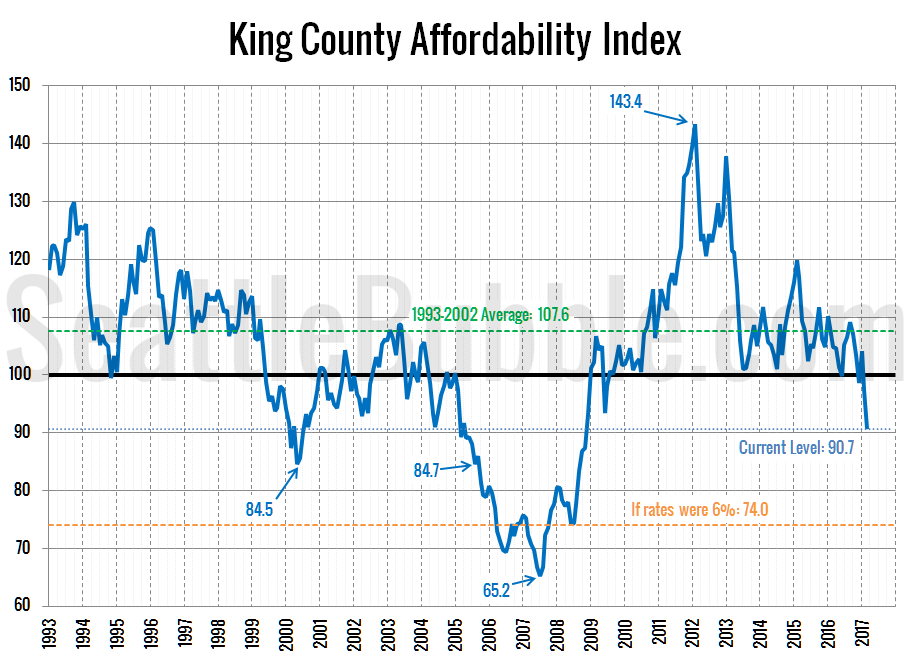
As promised yesterday, here’s an updated look at the “affordable home” price chart.
…
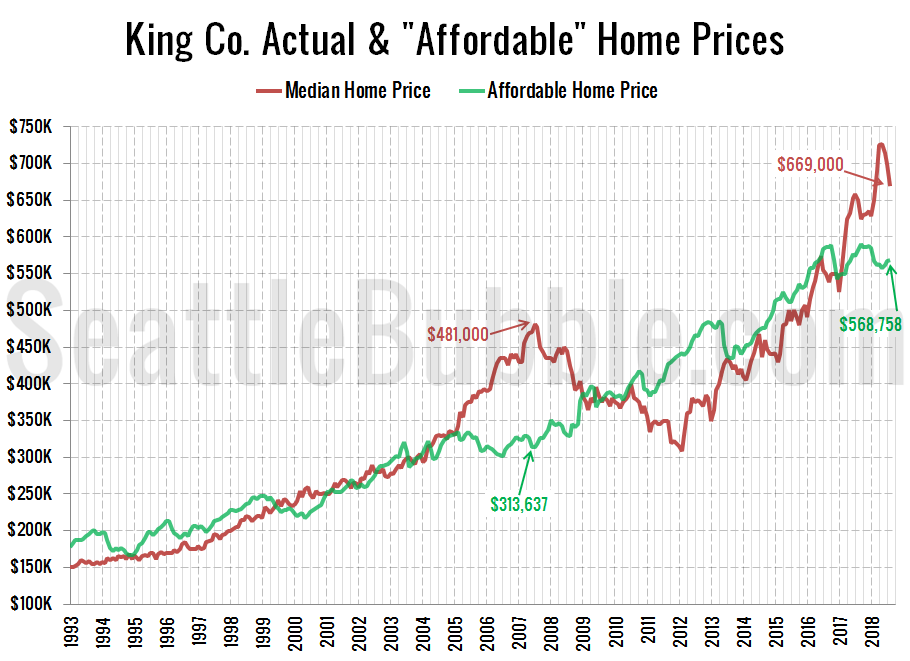
The “affordable” home price has bounced around between about $550,000 and $590,000 since the beginning of 2017. The current “affordable” home price of $568,758 in King County would have a monthly payment of $2,319…
Tag: affordability
Low affordability may be why sales are stalling out
By popular request, let’s take a look at our affordability index charts for the counties around Puget Sound.
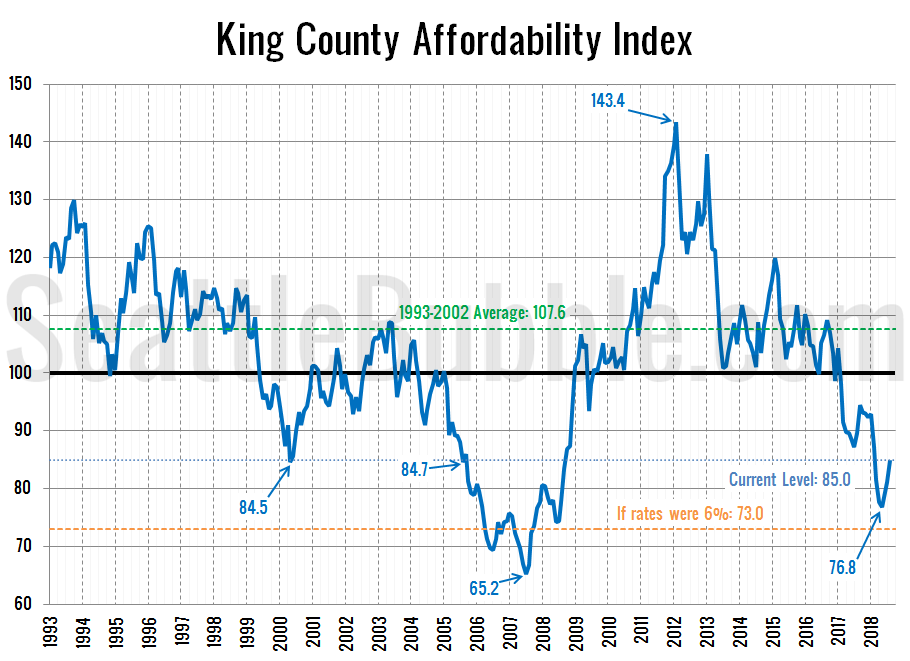
As of August, the affordability index has bounced up slightly from its May low (which was the lowest point since nearly a decade ago in July 2008), but still sits at the very low level of 85.0.
For context, eighty-six percent of the 306 months on record back through 1993 have had a higher affordability index than what we had in August 2018…
King County median home price now $77k higher than “Affordable” home price
As promised in Monday’s affordability post, here’s an updated look at the “affordable home” price chart.
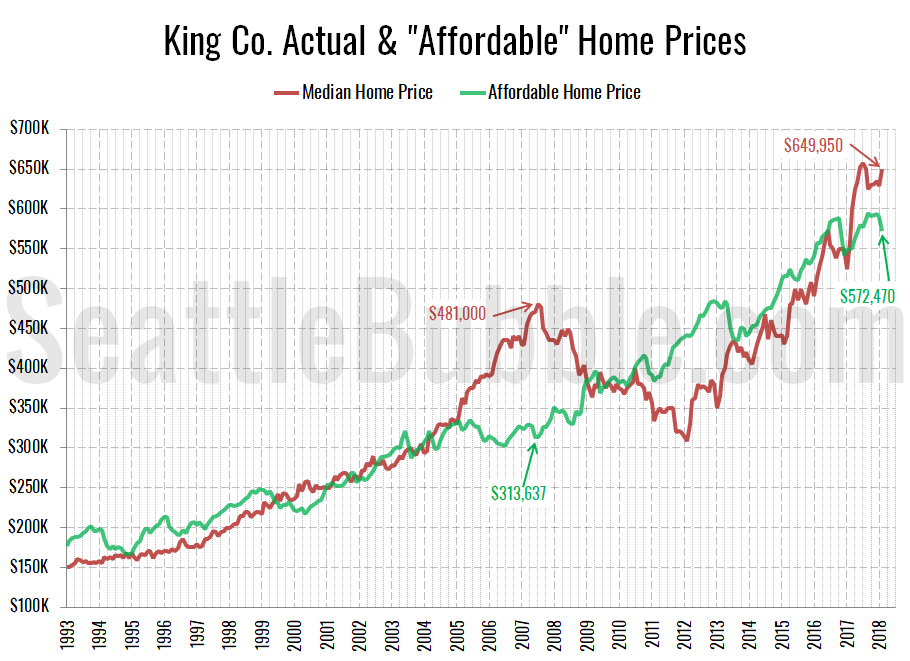
In this graph I flip the variables in the affordability index calculation around to other sides of the equation to calculate what price home the a family earning the median household income could “afford” to buy at today’s mortgage rates, if they spent 30% of their monthly gross income on their home payment. Don’t forget that this math includes the (giant) assumption that the home buyers putting 20% down, which would be $129,990 at today’s median price.
Seattle-area affordability set to plunge to 9-year lows in 2018
If you’re wondering about the lack of posts on these pages recently, the explanation is pretty simple: There just isn’t much to say. The Seattle-area housing market has been in a protracted boom period with ridiculously low inventory of homes for sale and rapidly-climbing prices for years now. In a lot of ways it looks like the housing bubble that was in full swing when I started this blog in 2005, but what’s going on behind the scenes is very different this time around. Is it possible that Seattle really is special this time around and the “bubble” won’t burst this time? … Maybe?
Anyway, I’ve been meaning to update more of the charts of the “fundamentals,” so let’s start with an updated look at our affordability index charts for the counties around Puget Sound.
Affordability Index Falls To Early 2005 Levels
With all of the first quarter behind us, and the question of whether or not we’re in another real estate bubble here in Seattle on everyone’s minds, let’s take an updated look at our affordability index charts for the counties around Puget Sound.
As of March, affordability has now fallen to its lowest level since November 2008, and as has been the case for quite a while, it would be considerably worse if not for the current absurdly low interest rates.
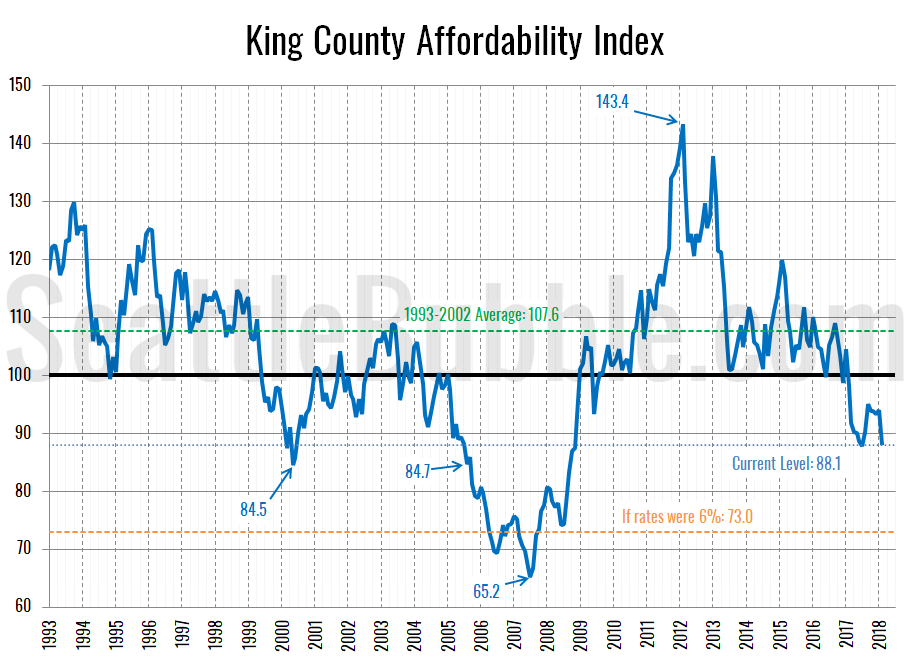
Median home prices have already begun their annual spring bump, while interest rates have ticked up slightly. The affordability index for King County currently sits at 90.7.
