Skip to content

Seattle Bubble

local real estate news, statistics, and commentary without the sales spin.

Menu
  • Home
  • About
  • Contact
  • Reference
  • Speaking
Menu

Tag: Case-Shiller

Case-Shiller: Seattle’s streak on top continues…

Posted on July 2, 2018July 2, 2018 by The Tim

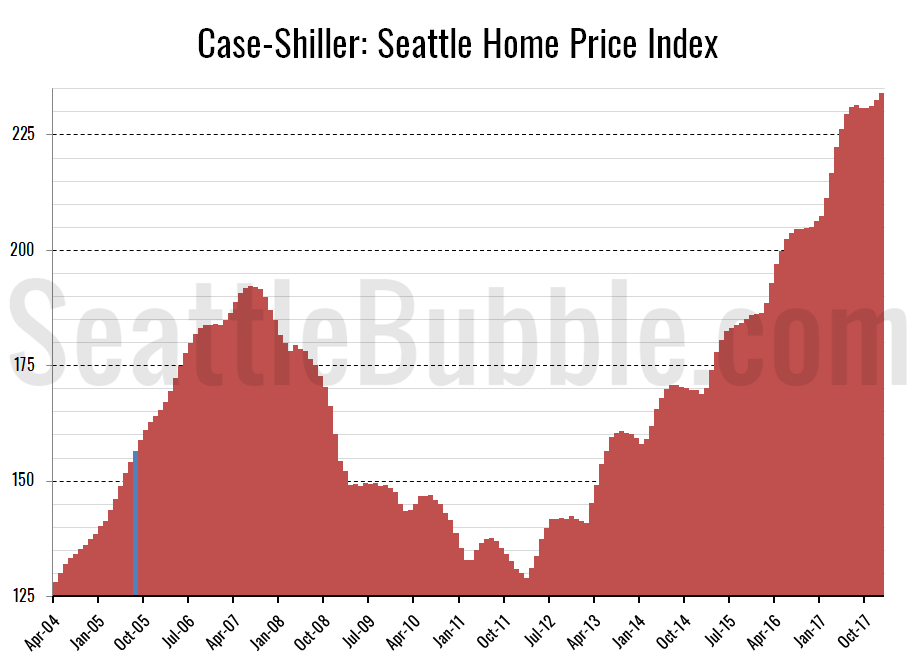
Let’s have a look at the latest data from the Case-Shiller Home Price Index. According to April data that was released last week, Seattle-area home prices were:

Up 2.7 percent March to April
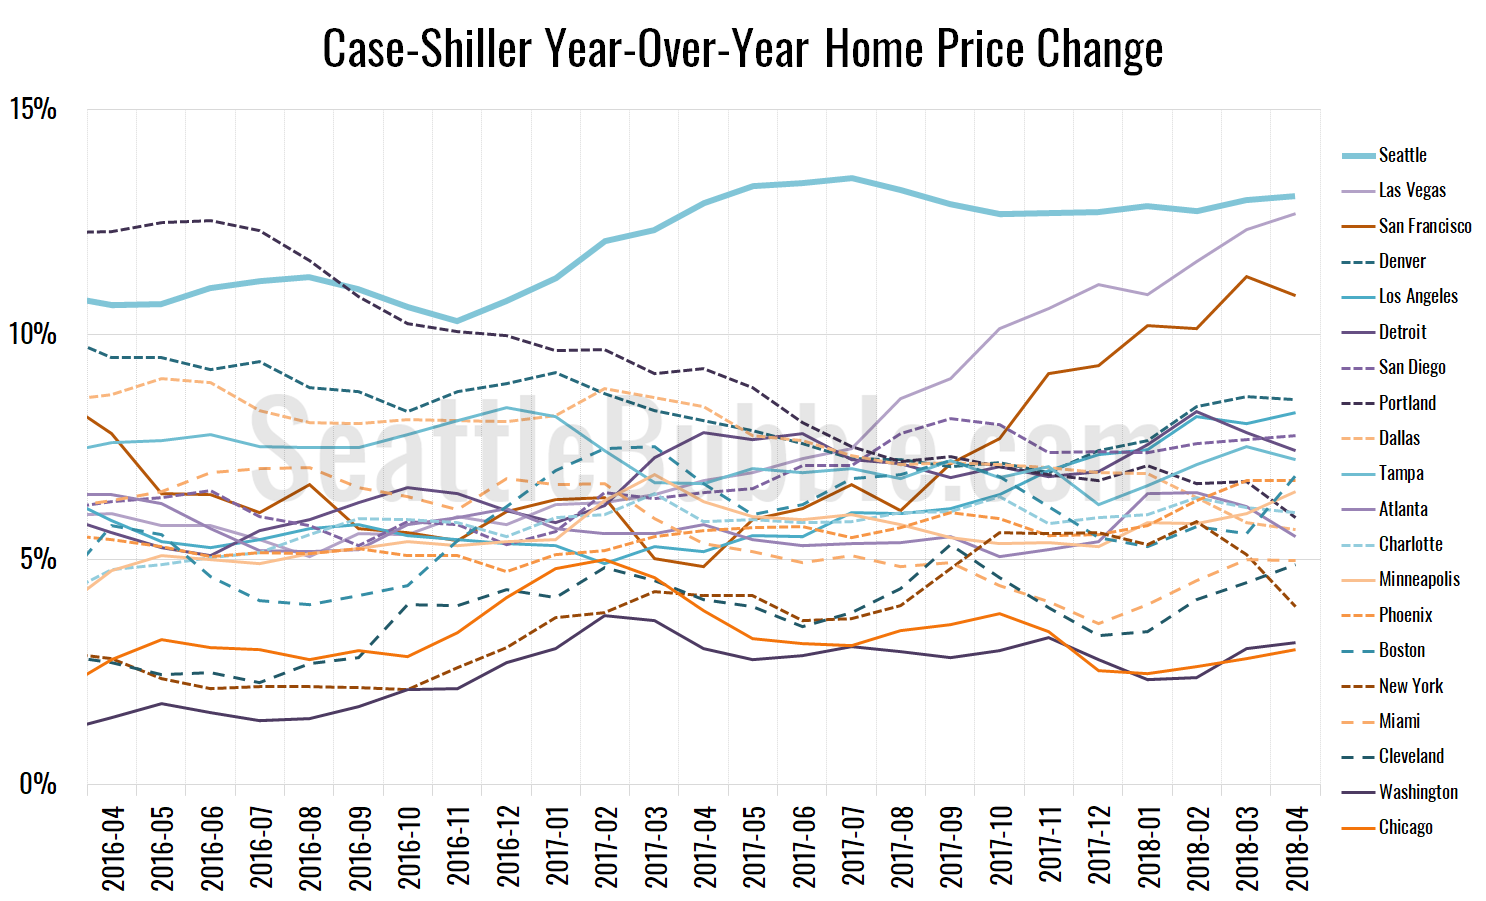
Up 13.1 percent year-over-year.
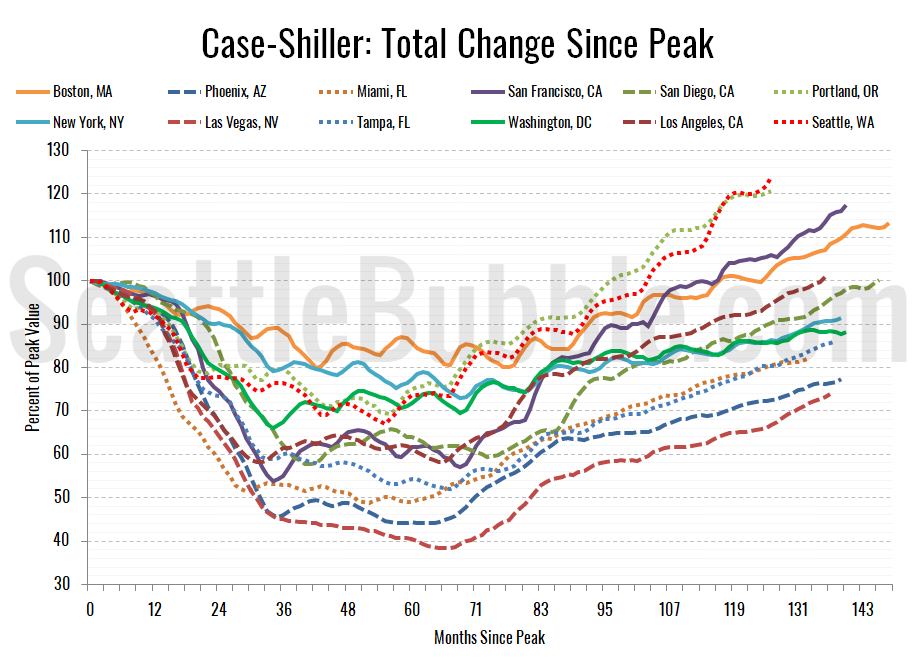
Up 30.8 percent from the July 2007 peak

Over the same period last year prices were up 2.6 percent month-over-month and year-over-year prices were up 12.9 percent.

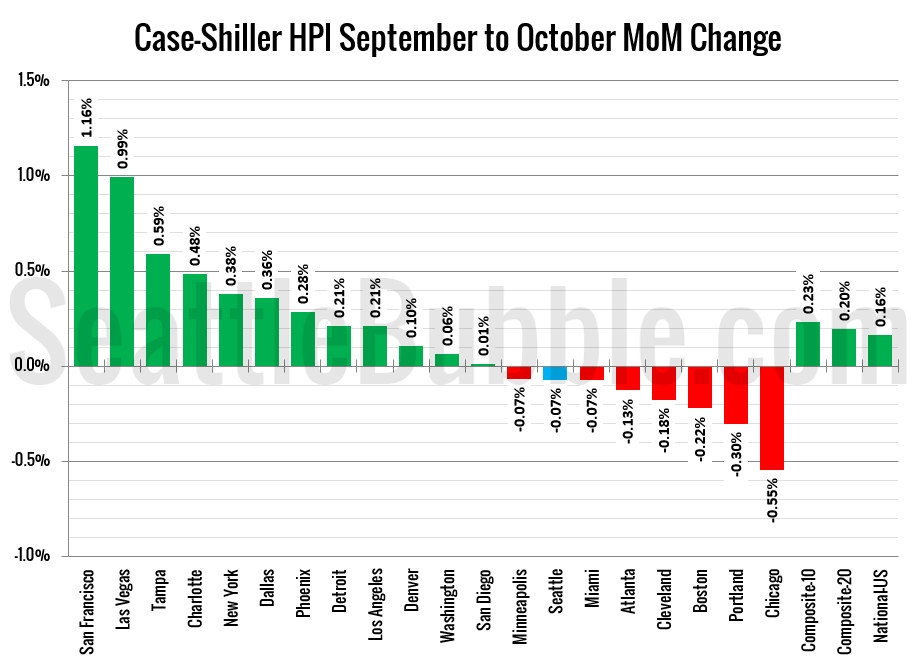
Seattle still leads the nation in both year-over-year and month-over-month home price growth. Seattle has had the highest year-over-year price growth since September 2016. The only other metro areas with double-digit price growth from a year earlier in April were Las Vegas at 12.7 percent and San Francisco at 10.9 percent.

Share:

  • Twitter
  • LinkedIn
  • Facebook
  • Reddit
  • Pinterest
  • Email

Case-Shiller: Seattle home prices rising fastest in the nation

Posted on April 24, 2018 by The Tim

Let’s have a look at the latest data from the Case-Shiller Home Price Index. According to February data that was released this morning, Seattle-area home prices were:

Up 1.7 percent January to February
Up 12.7 percent year-over-year.
Up 23.9 percent from the July 2007 peak

Over the same period last year prices were up 1.8 percent month-over-month and year-over-year prices were up 12.1 percent.

Seattle leads the nation in both year-over-year and month-over-month home price growth. The only other metro areas with double-digit price growth from a year earlier are Las Vegas at 11.6 percent and San Francisco at 10.1 percent.

Share:

  • Twitter
  • LinkedIn
  • Facebook
  • Reddit
  • Pinterest
  • Email

Case-Shiller Tiers: To. The. Moon.

Posted on March 28, 2018March 28, 2018 by The Tim

Let’s check out the three price tiers for the Seattle area, as measured by Case-Shiller. Remember, Case-Shiller’s “Seattle” data is based on single-family home repeat sales in King, Pierce, and Snohomish counties.

Note that the tiers are determined by sale volume. In other words, 1/3 of all sales fall into each tier. For more details on the tier methodologies, hit the full methodology pdf. Here are the current tier breakpoints:

  • Low Tier: < $373,070 (up 0.2%)
  • Mid Tier: $373,070 – $604,377
  • Hi Tier: > $604,377 (up 0.3%)

Share:

  • Twitter
  • LinkedIn
  • Facebook
  • Reddit
  • Pinterest
  • Email

Case-Shiller: Seattle kicks off 2018 with surging home prices

Posted on March 27, 2018March 28, 2018 by The Tim

Let’s have a look at the latest data from the Case-Shiller Home Price Index. According to January data that was released this week, Seattle-area home prices were:

Up 0.7 percent December to January
Up 12.9 percent year-over-year.
Up 21.8 percent from the July 2007 peak

Over the same period last year prices were up 0.6 percent month-over-month and year-over-year prices were up 11.3 percent.

Seattle still leads the nation in year-over-year price growth. The only other metro areas with double-digit price growth from a year earlier are Las Vegas at 11.1 percent and San Francisco at 10.3 percent.

Share:

  • Twitter
  • LinkedIn
  • Facebook
  • Reddit
  • Pinterest
  • Email

Case-Shiller: Seattle home prices edged down just barely in October

Posted on December 29, 2017 by The Tim

Let’s have a look at the latest data from the Case-Shiller Home Price Index. According to October data that was released this week, Seattle-area home prices were:

Down 0.1 percent September to October
Up 12.7 percent year-over-year.
Up 20.0 percent from the July 2007 peak

Over the same period last year prices were up 0.1 percent month-over-month and year-over-year prices were up 10.6 percent.

Seattle still has by far the largest year-over-year price growth, despite falling off just slightly in each of the last three months of data. The only other city with double-digit price growth from a year earlier is Las Vegas at 10.2 percent.

Share:

  • Twitter
  • LinkedIn
  • Facebook
  • Reddit
  • Pinterest
  • Email

Posts navigation

  • Previous
  • 1
  • 2
  • 3
  • 4
  • 5
  • 6
  • …
  • 58
  • Next

Tim’s Other Projects

Dispatches from the Multiverse

Tip Jar

Like what we're doing?

Drop us a tip!

Accounts

  • Log in
  • Entries feed
  • Comments feed
  • WordPress.org
©2024 Seattle Bubble | Built using WordPress and Responsive Blogily theme by Superb