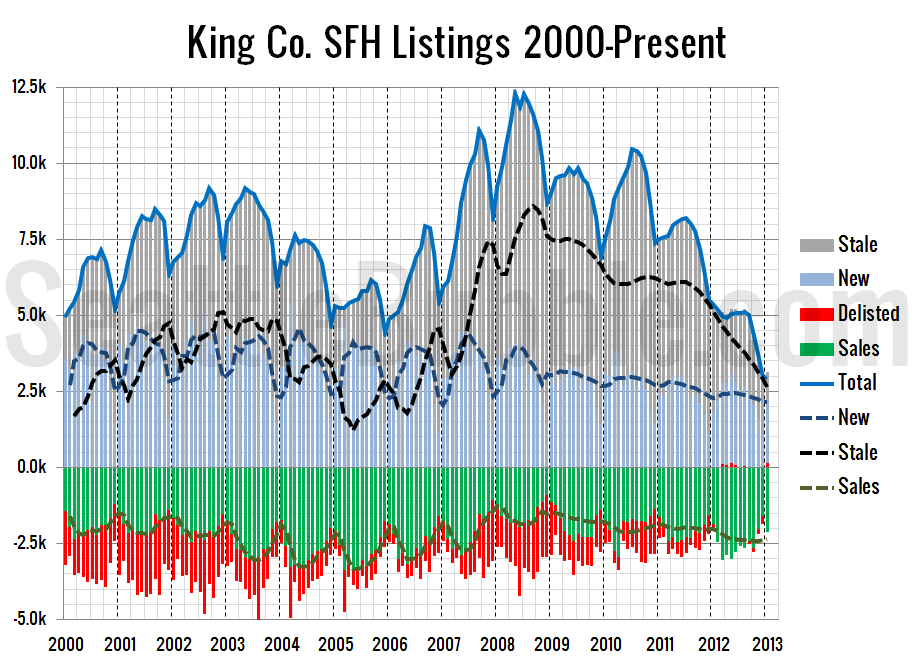
Here’s a view on listings that we haven’t visited in a while. In this chart I use the NWMLS-published data on new listings, pending sales, and total inventory to visualize the inflow and outflow of single-family listings in King County. First up is a chart that goes back as far as NWMLS data is available:…
Tag: delisting
Total Delistings by Year: 2001-2008
On last Friday’s delistings update post, a reader requested that I provide a view of the data showing cumulative year-long numbers. So, here it is: What stands out to me is how relatively stable the number of new listings has been through the past eight years, varying less than 20% from the lowest year (2008)…
Delistings on the Decline
Yesterday’s conversation in the comments touched a little bit on homes that are being delisted (taken off the market without selling), so now seems like a good time to post another update to the listings and sales breakdown chart. Below is the breakdown of homes on the market and homes that went off the market…
Fourth Quarter Sales in the Gutter, Delistings Stable
Let’s take a look at 2008’s fourth quarter closed sales volume for King County: That’s a drop of 31% from 2007, and also 31% from the previous quarter. The “usual” drop from Q3 to Q4 is 10-20%. At this point, I really don’t think sales have much further to drop. They’re practically as low as…
Delistings Stabilized in November
Here’s the breakdown of homes on the market and homes that went off the market last month in King County (SFH only). While the number of delistings had been dramatically increasing year-over-year earlier since June last year—even reaching 200% YOY in April—the rapid growth seems to have leveled off, with November’s 1,758 delistings nearly matching…
