Skip to content

Seattle Bubble

local real estate news, statistics, and commentary without the sales spin.

Menu
  • Home
  • About
  • Contact
  • Reference
  • Speaking
Menu

Tag: fundamentals

Actual Home Prices Edging Above the “Affordable” Price

Posted on September 24, 2015September 29, 2015 by The Tim

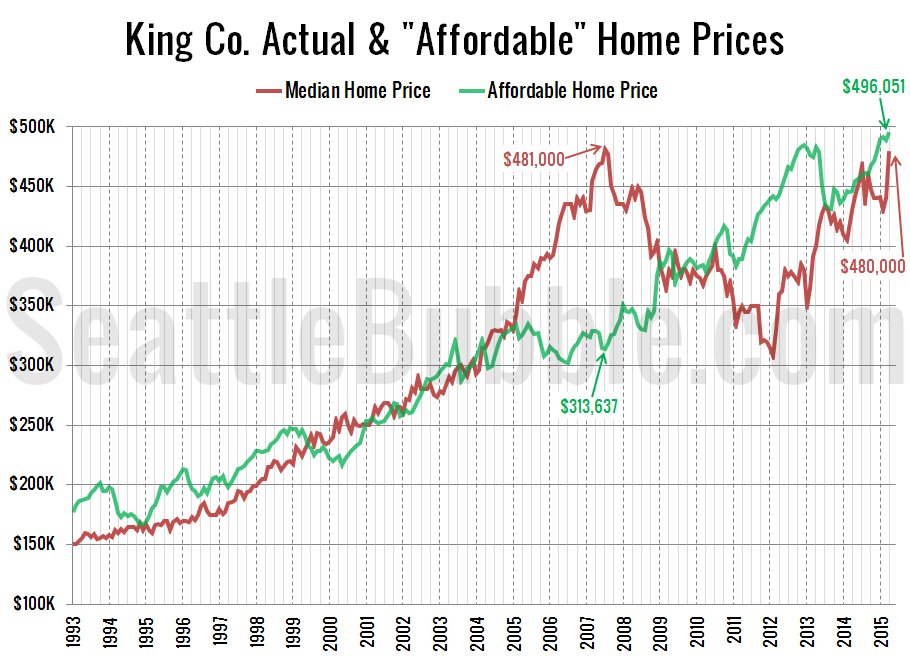
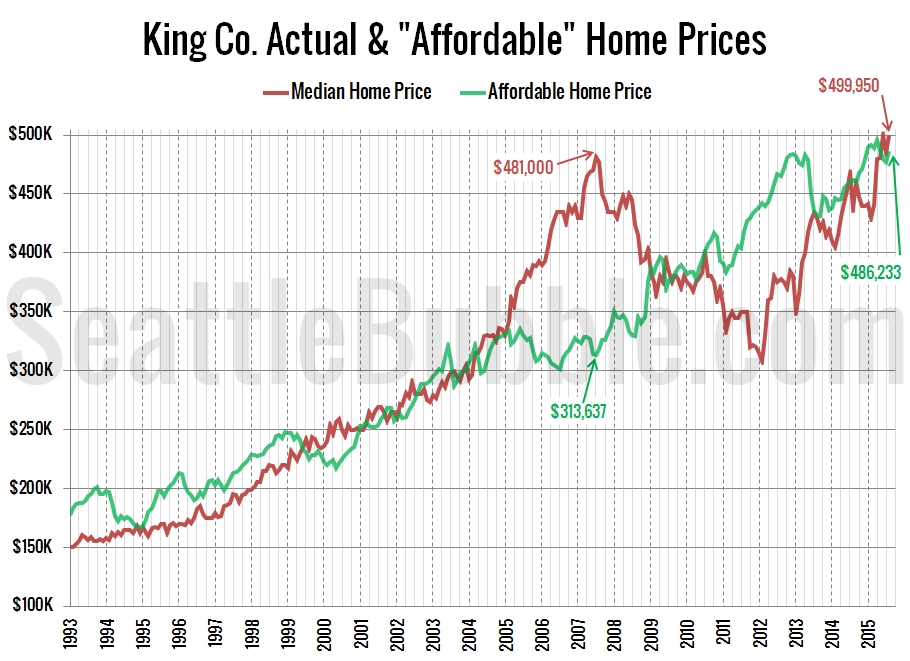
Here’s an updated look at the “affordable home” price chart.

In this graph I flip the variables in the affordability index calculation around to other sides of the equation to calculate what price home the a family earning the median household income could afford to buy at today’s mortgage rates if they put 20% down and spent 30% of their monthly income.

The “affordable” home price hit $496,051 back in April, but has since dropped off…

Share:

  • Twitter
  • LinkedIn
  • Facebook
  • Reddit
  • Pinterest
  • Email

Affordability Will Be Destroyed if Interest Rates Increase

Posted on September 23, 2015September 27, 2022 by The Tim

Don’t forget, you can get access to the spreadsheets used to make the charts in this and other posts by becoming a member of Seattle Bubble. It’s been a few months since we took a look at the local affordability index. So, let’s have a new look at all of our affordability index charts. As…

Share:

  • Twitter
  • LinkedIn
  • Facebook
  • Reddit
  • Pinterest
  • Email

Home Price to Rent Ratio Still Below Bubble Territory

Posted on August 13, 2015August 18, 2015 by The Tim

It’s been a while since we took a look at how rents are comparing to home prices in the Seattle area. Both home prices and rents have been climbing quite a bit in the Seattle area lately. We would expect this with a booming local economy, but if home price gains been significantly outpacing rent…

Share:

  • Twitter
  • LinkedIn
  • Facebook
  • Reddit
  • Pinterest
  • Email

Price to Income Ratio Back in Bubble Territory

Posted on July 24, 2015July 27, 2015 by The Tim

It has been a while since we last looked at one of our primary housing bubble metrics: local home prices compared to incomes. In the next chart I am using the Case-Shiller Home Price Index for the Seattle area (which rolls together King, Snohomish, and Pierce counties) and Bureau of Economic Analysis data on per…

Share:

  • Twitter
  • LinkedIn
  • Facebook
  • Reddit
  • Pinterest
  • Email

Low Rates Add $120K to the “Affordable” Home Price

Posted on May 21, 2015May 26, 2015 by The Tim

As promised in yesterday’s affordability post, here’s an updated look at the “affordable home” price chart. In this graph I flip the variables in the affordability index calculation around to other sides of the equation to calculate what price home the a family earning the median household income could afford to buy at today’s mortgage…

Share:

  • Twitter
  • LinkedIn
  • Facebook
  • Reddit
  • Pinterest
  • Email

Posts navigation

  • Previous
  • 1
  • 2
  • 3
  • 4
  • 5
  • 6
  • …
  • 20
  • Next

Tim’s Other Projects

Dispatches from the Multiverse

Tip Jar

Like what we're doing?

Drop us a tip!

Accounts

  • Log in
  • Entries feed
  • Comments feed
  • WordPress.org
©2024 Seattle Bubble | Built using WordPress and Responsive Blogily theme by Superb
Menu
  • Home
  • About
  • Contact
  • Reference
  • Speaking