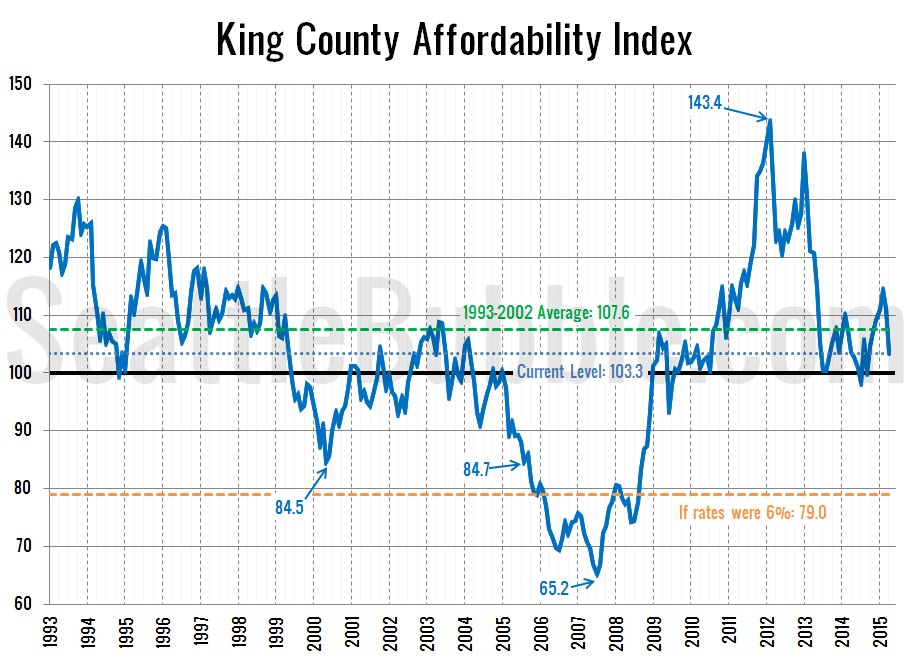
A reader pointed out that we haven’t looked at how the affordability index is doing in the Seattle area since late last year. Let’s update our standard charts. So how does affordability look as of April? Despite median home prices shooting up, falling interest rates that are back below 4 percent again have kept the…
Tag: fundamentals
Affordable Home Price Climbs Above Median Price
As promised in yesterday’s affordability post, here’s an updated look at the “affordable home” price chart. In this graph I flip the variables in the affordability index calculation around to other sides of the equation to calculate what price home the a family earning the median household income could afford to buy at today’s mortgage…
Affordability Index Bounces Back Above 100
Let’s take a look at how affordability is doing in the Seattle area after the last few months of changes in home prices and interest rates. So how does affordability look as of October? With home prices stagnating this fall and interest rates inching back down close to 4 percent, the affordability index moved back…
Another Bubble? Affordability Only Sustained By Low Rates
Continuing our “Another Bubble?” series, it’s time to take a look at the affordability index. As King County’s median home price has surged from $405,400 in February to $468,000 in July, the affordability index has dropped from slightly above the long-term average to just below 100. An index level above 100 indicates that the monthly…
Another Bubble? Home Prices Rapidly Outgain Incomes
Continuing the “Another Bubble?” series we began yesterday, let’s take a look at another housing bubble metric: home prices compared to incomes. For this post I’ll be using the Case-Shiller Home Price Index for the Seattle area (which rolls together King, Snohomish, and Pierce counties) and Bureau of Economic Analysis data on per capita incomes…