Skip to content

Seattle Bubble

local real estate news, statistics, and commentary without the sales spin.

Menu
  • Home
  • About
  • Contact
  • Reference
  • Speaking
Menu

Tag: graphs

Case-Shiller: Seattle-Area Home Prices Surged In February

Posted on April 25, 2017April 25, 2017 by The Tim

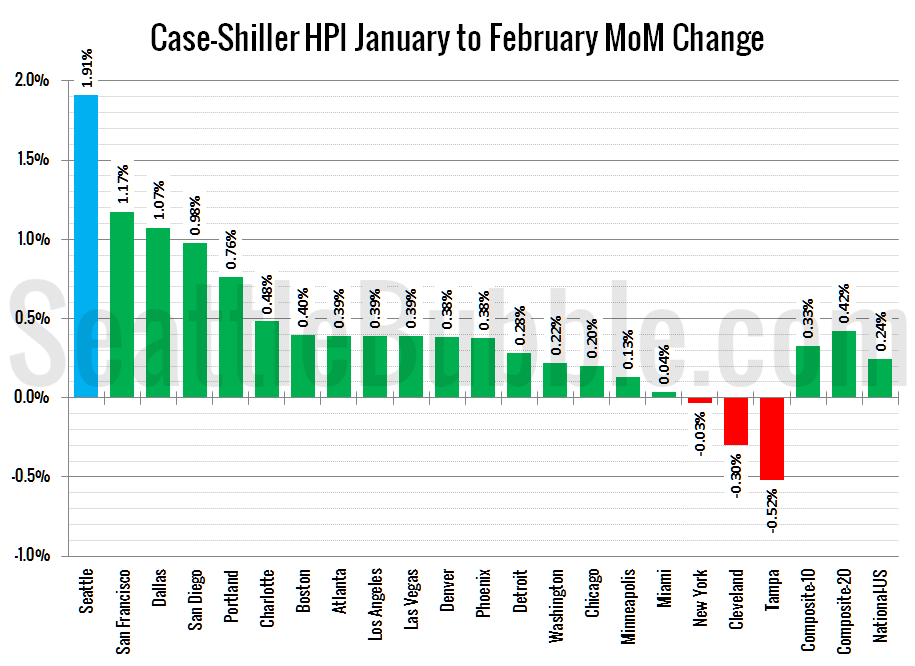
Let’s have a look at the latest data from the Case-Shiller Home Price Index. According to February data that was released this morning, Seattle-area home prices were:

Up 1.9 percent January to February
Up 12.2 percent year-over-year.
Up 10.0 percent from the July 2007 peak

Over the same period a year earlier prices were up 1.1 percent month-over-month and year-over-year prices were up 10.7 percent.

Seattle home prices as measured by Case-Shiller shot up yet again to a new all-time high in February.

Share:

  • Twitter
  • LinkedIn
  • Facebook
  • Reddit
  • Pinterest
  • Email

Case-Shiller: Seattle Home Prices Up, Up, Up In January

Posted on March 28, 2017 by The Tim

Let’s have a look at the latest data from the Case-Shiller Home Price Index. According to November data that was released this morning, Seattle-area home prices were:

Up 0.6 percent December to January
Up 11.3 percent year-over-year.
Up 7.9 percent from the July 2007 peak

Over the same period a year earlier prices were up 0.1 percent month-over-month and year-over-year prices were up 10.5 percent.

Seattle home prices as measured by Case-Shiller inched up yet again to a new all-time high in January.

Share:

  • Twitter
  • LinkedIn
  • Facebook
  • Reddit
  • Pinterest
  • Email

Case-Shiller: Seattle Home Prices Keep Edging Up

Posted on March 3, 2017 by The Tim

It’s a bit late, but we’re doing this anyway. Let’s have a look at the latest data from the Case-Shiller Home Price Index. According to November data that was released this morning, Seattle-area home prices were: Up 0.6 percent November to December Up 10.8 percent year-over-year. Up 7.3 percent from the July 2007 peak Over…

Share:

  • Twitter
  • LinkedIn
  • Facebook
  • Reddit
  • Pinterest
  • Email

Around the Sound: Even Far From Seattle, No Relief For Buyers

Posted on February 9, 2017 by The Tim

Get access to the full spreadsheets used to make the charts in this and other posts, and support the ongoing work on this site by becoming a member of Seattle Bubble. Let’s have a look at our housing stats for the broader Puget Sound area. Here’s your July update to our “Around the Sound” statistics…

Share:

  • Twitter
  • LinkedIn
  • Facebook
  • Reddit
  • Pinterest
  • Email

Case-Shiller: Seattle Home Price Growth Barely Slowed in November

Posted on January 31, 2017 by The Tim

Let’s have a look at the latest data from the Case-Shiller Home Price Index. According to November data that was released this morning, Seattle-area home prices were: Up 0.2 percent October to November Up 10.4 percent YOY. Up 6.8 percent from the July 2007 peak Over the same period last year prices were up 0.4…

Share:

  • Twitter
  • LinkedIn
  • Facebook
  • Reddit
  • Pinterest
  • Email

Posts navigation

  • Previous
  • 1
  • …
  • 3
  • 4
  • 5
  • 6
  • 7
  • 8
  • 9
  • …
  • 47
  • Next

Tim’s Other Projects

Dispatches from the Multiverse

Tip Jar

Like what we're doing?

Drop us a tip!

Accounts

  • Log in
  • Entries feed
  • Comments feed
  • WordPress.org
©2024 Seattle Bubble | Built using WordPress and Responsive Blogily theme by Superb