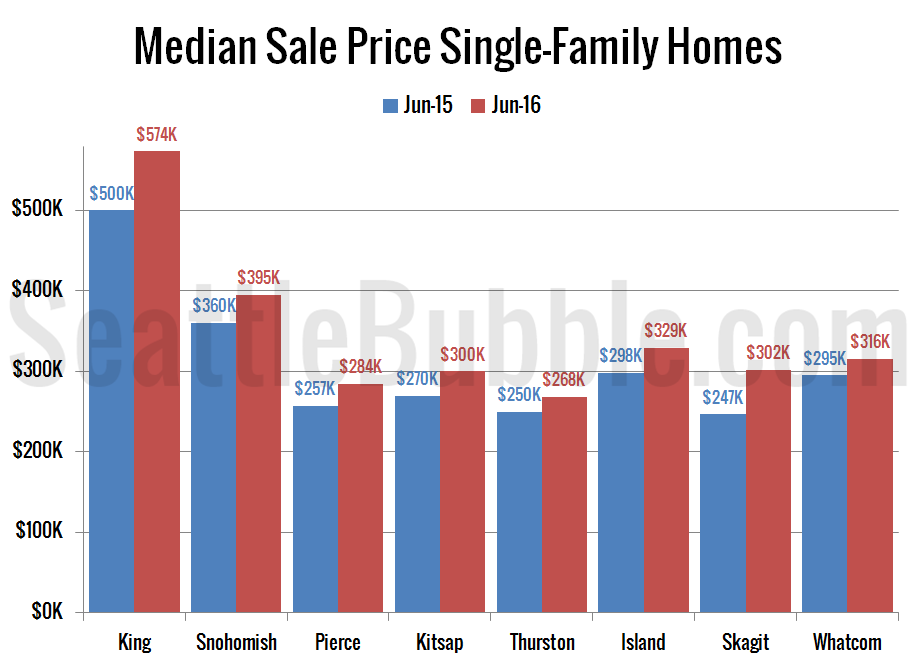
Get access to the full spreadsheets used to make the charts in this and other posts, and support the ongoing work on this site by becoming a member of Seattle Bubble. Let’s have a look at our housing stats for the broader Puget Sound area. Here’s your July update to our “Around the Sound” statistics…