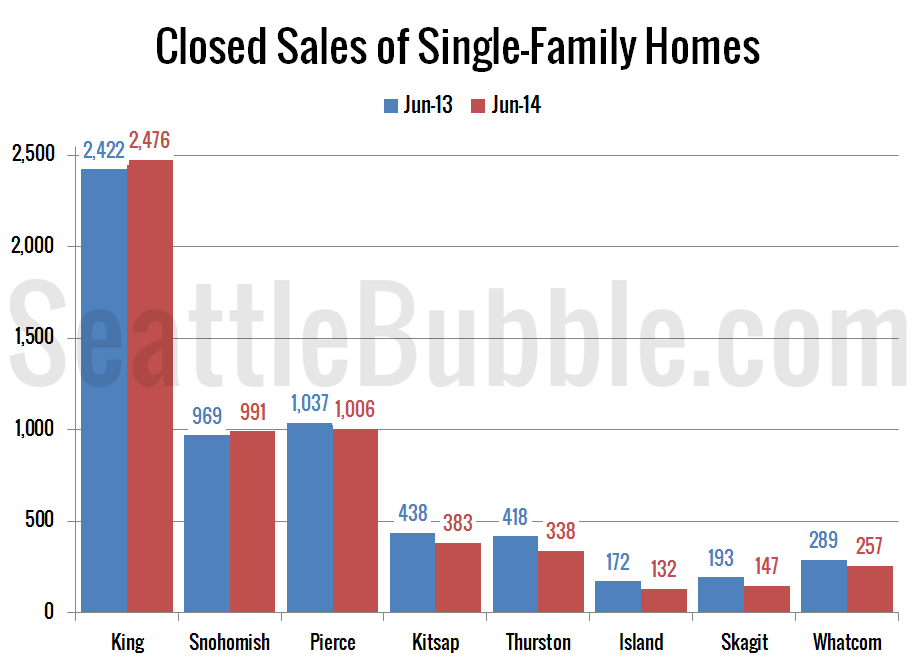
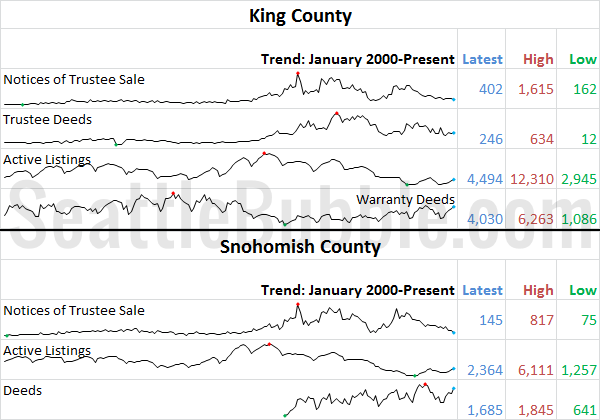
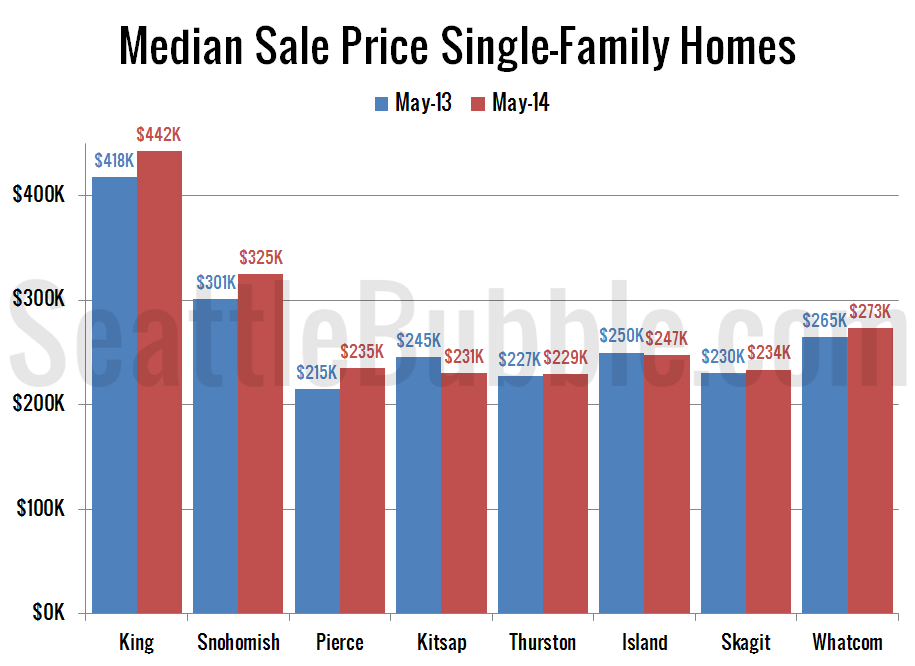
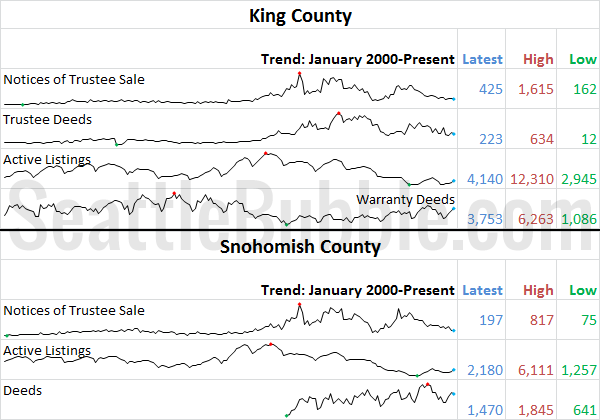
It’s time for us to check up on stats outside of the King/Snohomish core with our “Around the Sound” statistics for Pierce, Kitsap, Thurston, Island, Skagit, and Whatcom counties. If there is certain data you would like to see or ways you would like to see the data presented differently, drop a comment below and…