Skip to content

Seattle Bubble

local real estate news, statistics, and commentary without the sales spin.

Menu
  • Home
  • About
  • Contact
  • Reference
  • Speaking
Menu

Tag: Real Estate Heat Index

Real Estate Heat Index plummets in 2018—now at lowest level in over six years

Posted on October 10, 2018October 10, 2018 by The Tim

Like the charts and data that I’m posting? Want to support the ongoing work of this site? Good news, everyone! You can becoming a member of Seattle Bubble and get access to the data as well as other perks! We haven’t taken a look at my “Residential Real Estate Heat Index” for King County single-family…

Share:

  • Twitter
  • LinkedIn
  • Facebook
  • Reddit
  • Pinterest
  • Email

Real Estate Heat Index off the charts in 2017

Posted on January 11, 2018January 12, 2018 by The Tim

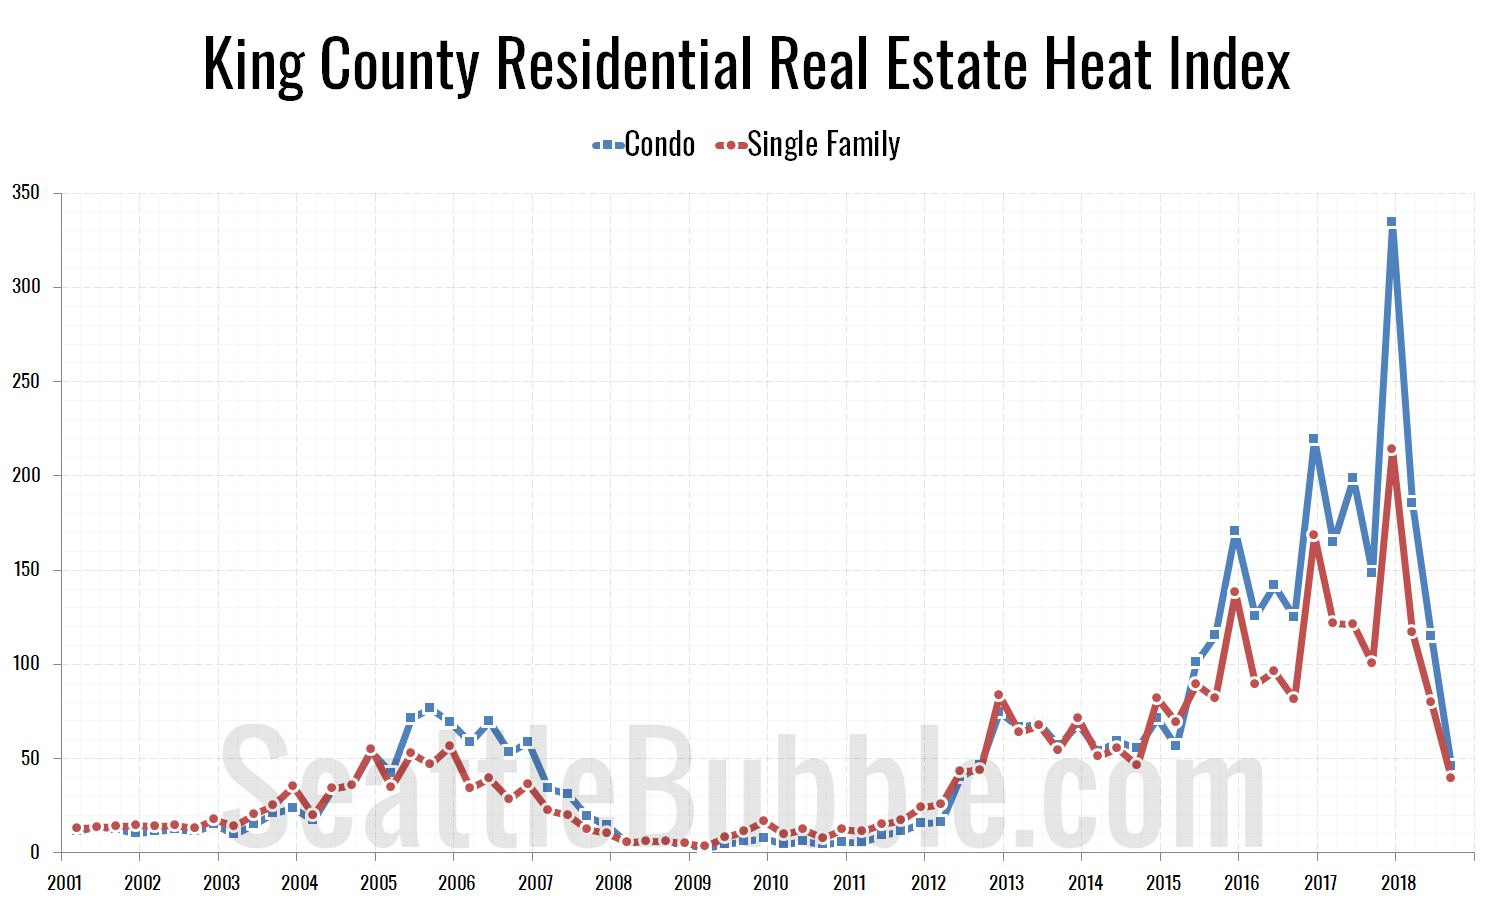
After the final 2017 Seattle-area real estate sales data was released last week by the NWMLS, I updated my chart of the “Residential Real Estate Heat Index” for King County single-family homes and condos.

As a reminder, the “Residential Real Estate Heat Index” is an index that rolls changes in the median price, new listings, total inventory, pending sales and closed sales all into a single number to measure the relative “heat” of the market. Note that this index only looks at the real estate sales market. It does not factor in any other economic conditions such as wages, interest rates, rents, etc.

Below is the latest data for the heat index of King County single-family homes and condos…

Share:

  • Twitter
  • LinkedIn
  • Facebook
  • Reddit
  • Pinterest
  • Email

Seattle Housing Market Hotter Than Ever in 2015

Posted on October 21, 2015October 26, 2015 by The Tim

I’d like to introduce a new chart. The “Residential Real Estate Heat Index” is an index I’ve been calculating for a few years, that originally was part of the now-defunct Sound Housing Quarterly newsletter. It rolls changes in the median price, new listings, total inventory, pending sales and closed sales all into a single number to measure the relative “heat” of the market.

Here’s what it looks like for King County single-family homes and condos…

Share:

  • Twitter
  • LinkedIn
  • Facebook
  • Reddit
  • Pinterest
  • Email

Help Me Improve Sound Housing Quarterly

Posted on September 6, 2011September 6, 2011 by The Tim

Welcome back, I hope everyone had an enjoyable Labor Day. Speaking of laboring, I recently finished another issue of Sound Housing Quarterly. For those not familiar with this project, it is a quarterly journal in which I roll up all of the vital local real estate statistics into one massive 40+ page tome, complete with…

Share:

  • Twitter
  • LinkedIn
  • Facebook
  • Reddit
  • Pinterest
  • Email

Hungry for More Data? Try Sound Housing Quarterly

Posted on May 2, 2011May 2, 2011 by The Tim

The latest issue of Sound Housing Quarterly has been published (Q1 2011). Sound Housing Quarterly is a subscription-based sister project to Seattle Bubble that I created to provide a single consolidated and consistent source of high-level local housing market stats and analysis. This month’s report sports 49 pages packed with unique housing market insights you…

Share:

  • Twitter
  • LinkedIn
  • Facebook
  • Reddit
  • Pinterest
  • Email

Posts pagination

  • 1
  • 2
  • 3
  • Next

Tim’s Other Projects

Dispatches from the Multiverse

Tip Jar

Like what we're doing?

Drop us a tip!

Accounts

  • Log in
  • Entries feed
  • Comments feed
  • WordPress.org
©2025 Seattle Bubble | Built using WordPress and Responsive Blogily theme by Superb