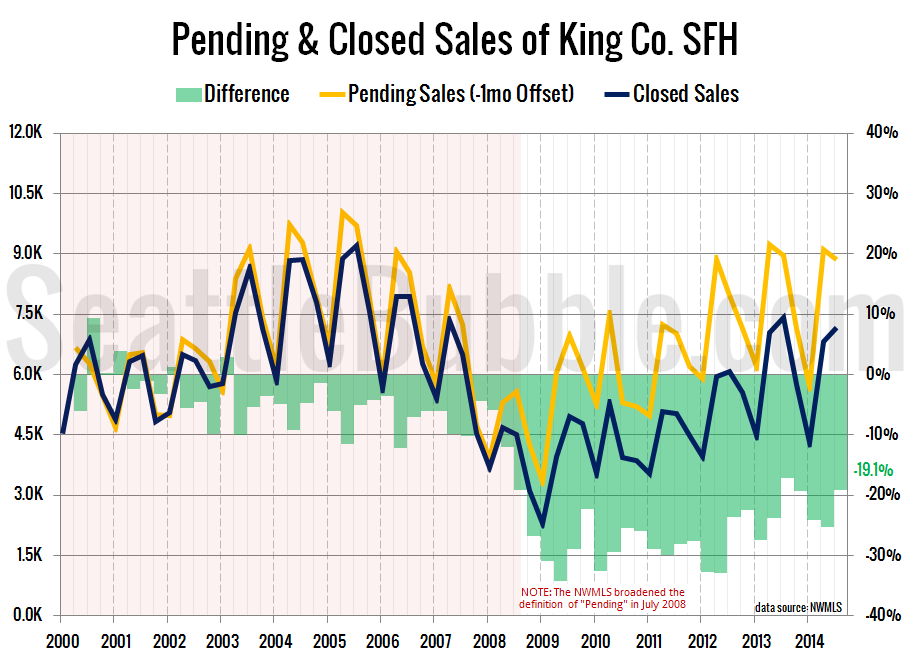
Let’s take a look a the latest data on pending sales volume versus closed sales volume. For this series I roll the pending sales and closed sales data up by quarter, with pending sales offset by one month. In other words, the third quarter numbers below represent pending sales from June, July, and August and…
Tag: sales
September Stats Preview: The Fall Lull Begins
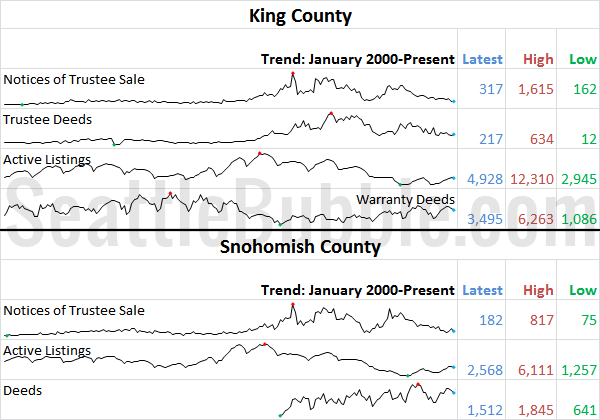
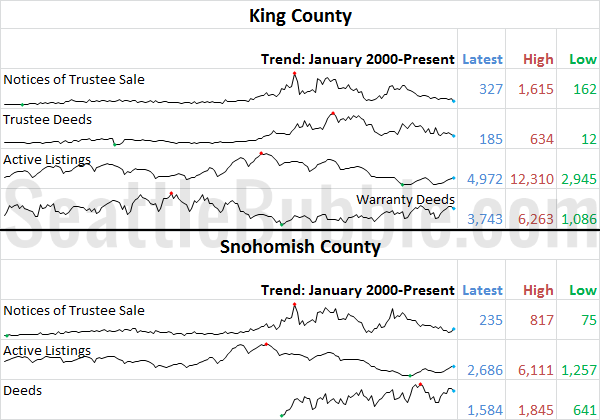
With September in the books, let’s have a look at our monthly stats preview. Most of the charts below are based on broad county-wide data that is available through a simple search of King County and Snohomish County public records. If you have additional stats you’d like to see in the preview, drop a line…
Sales Growth in 2014 Has Been the Weakest Since 2009
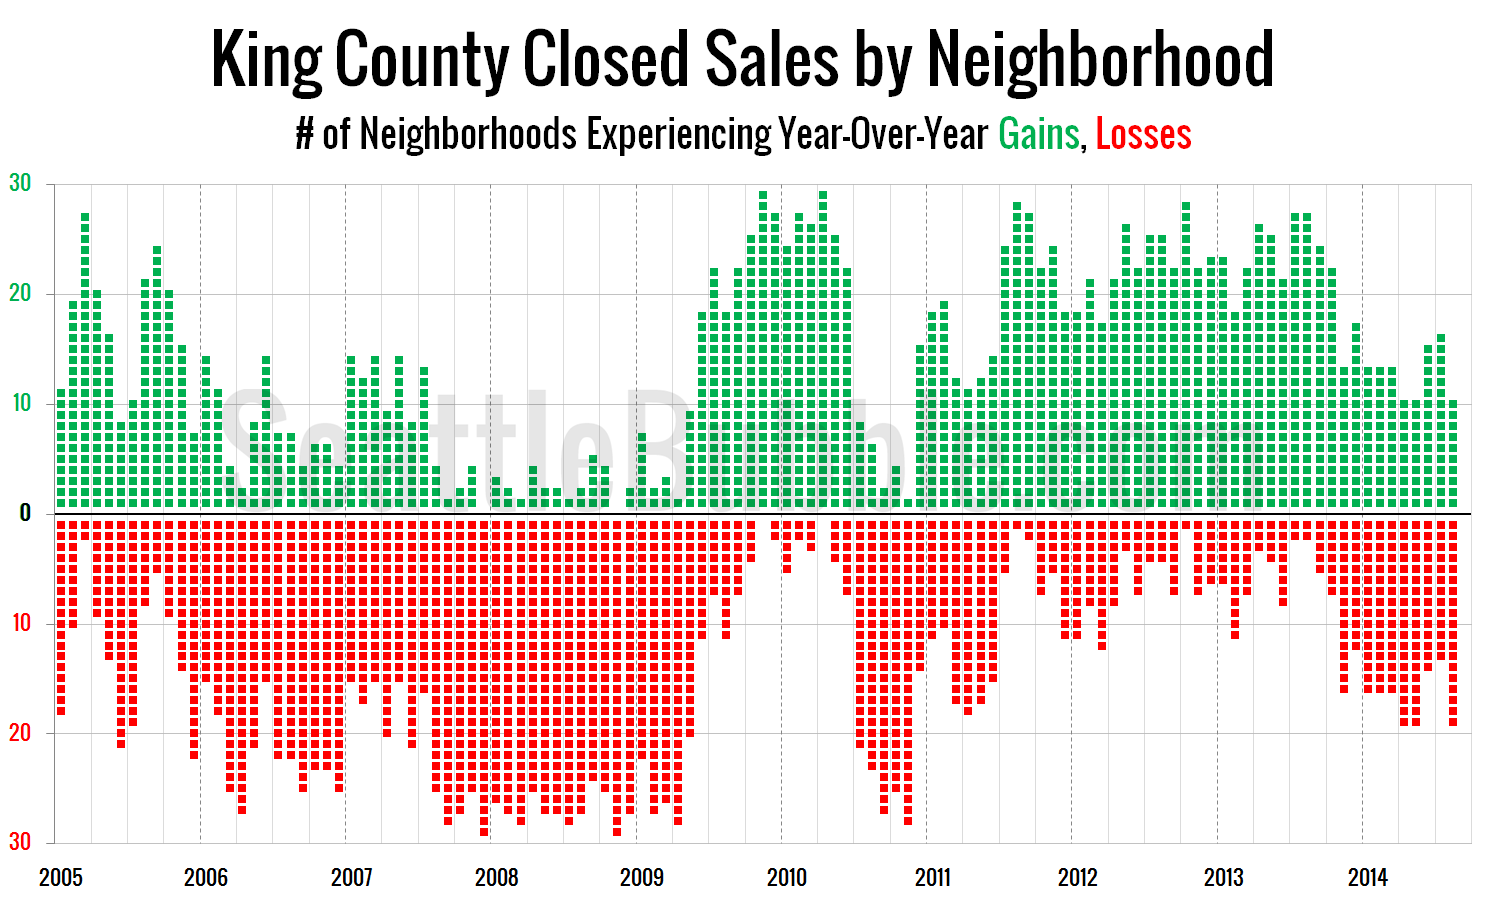
I thought it would be interesting to visualize year-over-year sales increases and decreases by NWMLS neighborhood in King County using the one of the views I created for Case-Shiller data. In the chart below each NWMLS-defined neighborhood in King County is represented by a green square if sales increased that month compared to a year…
Around the Sound: Moderation Across the Sound in August
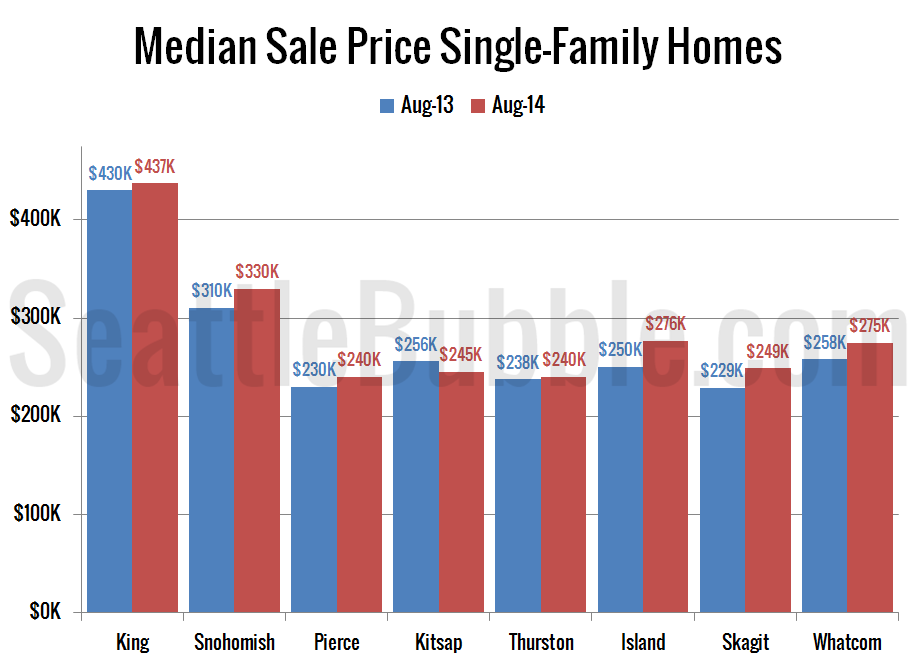
It’s time for us to check up on stats outside of the King/Snohomish core with our “Around the Sound” statistics for Pierce, Kitsap, Thurston, Island, Skagit, and Whatcom counties. If there is certain data you would like to see or ways you would like to see the data presented differently, drop a comment below and…
August Stats Preview: Sales Slippage Edition
With August behind us, let’s have a look at our monthly stats preview. Most of the charts below are based on broad county-wide data that is available through a simple search of King County and Snohomish County public records. If you have additional stats you’d like to see in the preview, drop a line in…
