Skip to content

Seattle Bubble

local real estate news, statistics, and commentary without the sales spin.

Menu
  • Home
  • About
  • Contact
  • Reference
  • Speaking
Menu

Tag: Statistics

Case-Shiller Tiers: More Across the Board Increases in June

Posted on August 27, 2015September 22, 2015 by The Tim

Get access to the full spreadsheets used to make the charts in this post by becoming a member of Seattle Bubble.

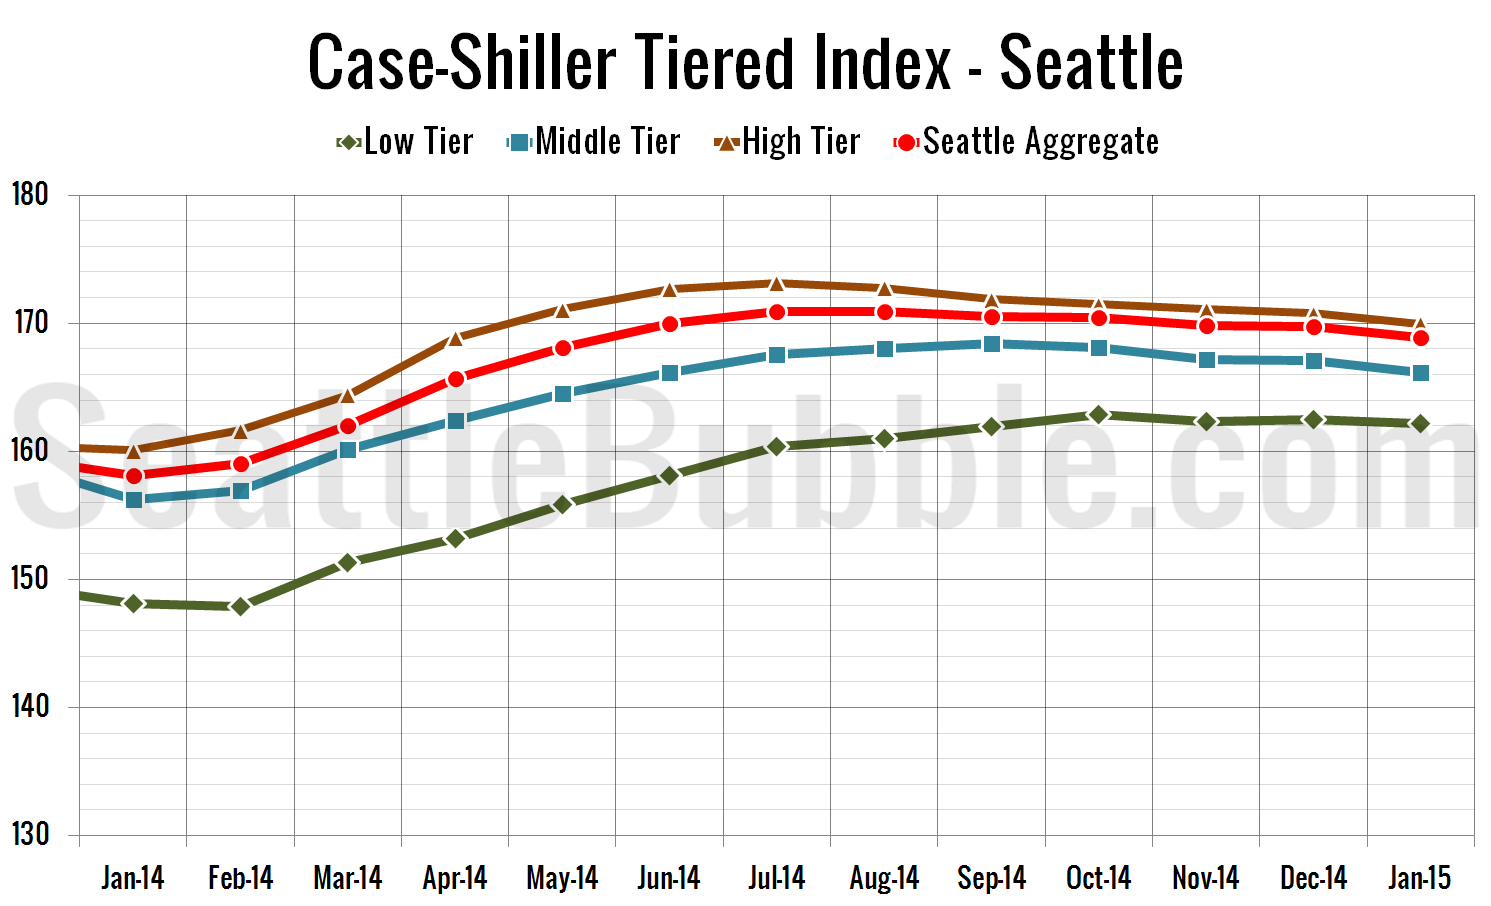
Let’s check out the three price tiers for the Seattle area, as measured by Case-Shiller. Remember, Case-Shiller’s “Seattle” data is based on single-family home repeat sales in King, Pierce, and Snohomish counties.

Note that the tiers are determined by sale volume. In other words, 1/3 of all sales fall into each tier…

Share:

  • Twitter
  • LinkedIn
  • Facebook
  • Reddit
  • Pinterest
  • Email

Case-Shiller: Year-Over-Year Gains Stabilizing in June

Posted on August 26, 2015September 4, 2015 by The Tim

Please consider supporting Seattle Bubble by becoming a member. Thanks!

Let’s have a look at the latest data from the Case-Shiller Home Price Index. According to April data, Seattle-area home prices were:

Up 1.1% May to June
Up 7.4% YOY…

Share:

  • Twitter
  • LinkedIn
  • Facebook
  • Reddit
  • Pinterest
  • Email

NWMLS: Home Prices & Sales Shot Up in March; Inventory Still Anemic

Posted on April 7, 2015 by The Tim

March market stats were published by the NWMLS yesterday. Before we get into our monthly stats, here’s a quick look at their press release. Frenzied Market Frustrating Buyers Buyer anxiety is rising as the pace of home sales is faster than brokers are able to replenish inventory, according to members of Northwest Multiple Listing Service….

Share:

  • Twitter
  • LinkedIn
  • Facebook
  • Reddit
  • Pinterest
  • Email

Case-Shiller: Home Prices Slipped Just Slightly in January

Posted on April 6, 2015 by The Tim

Let’s have a look at the latest data from the Case-Shiller Home Price Index. According to January data, Seattle-area home prices were: Down 0.5% December to January Up 6.8% YOY. Down 12.2% from the July 2007 peak Last year at this time prices fell 0.8% month-over-month and year-over-year prices were up 11.9%. Year-over-year price gains…

Share:

  • Twitter
  • LinkedIn
  • Facebook
  • Reddit
  • Pinterest
  • Email

NWMLS: Sales and Listings Both Inched Up in February

Posted on March 6, 2015March 9, 2015 by The Tim

February market stats were published by the NWMLS yesterday. Before we get into our monthly stats, let’s have a look at their press release. Early Spring Brings Bumper Crop of Homebuyers Who Face Inventory Drought Favorable weather and restored confidence are propelling home buying activity around Western Washington to the highest level in nearly a…

Share:

  • Twitter
  • LinkedIn
  • Facebook
  • Reddit
  • Pinterest
  • Email

Posts navigation

  • Previous
  • 1
  • …
  • 29
  • 30
  • 31
  • 32
  • 33
  • 34
  • 35
  • …
  • 134
  • Next

Tim’s Other Projects

Dispatches from the Multiverse

Tip Jar

Like what we're doing?

Drop us a tip!

Accounts

  • Log in
  • Entries feed
  • Comments feed
  • WordPress.org
©2024 Seattle Bubble | Built using WordPress and Responsive Blogily theme by Superb