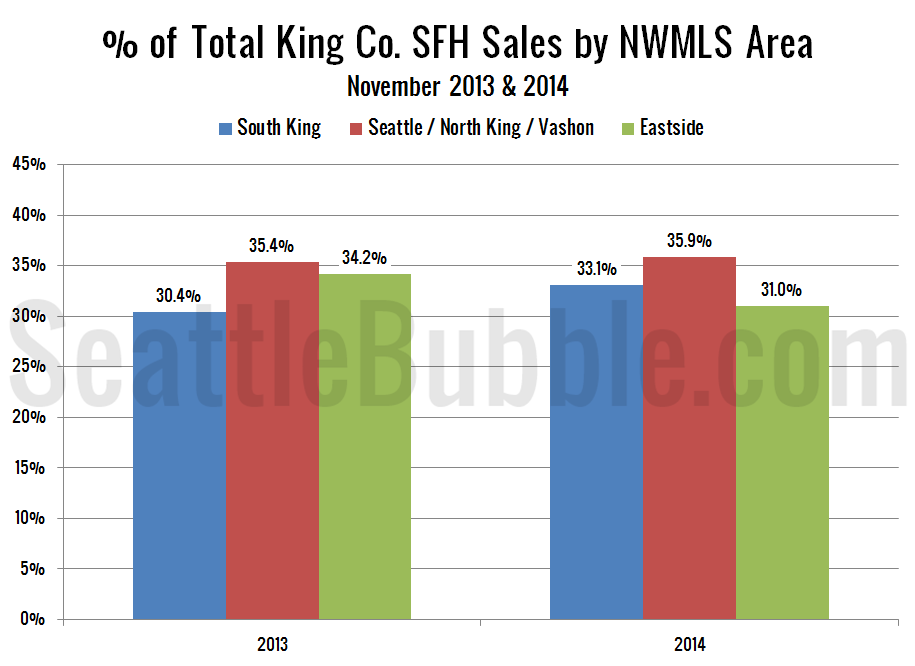
It’s time once again to take an updated look at how King County’s sales are shifting between the different regions around the county, since geographic shifts can and do affect the median price. In order to explore this concept, we break King County down into three regions, based on the NWMLS-defined “areas”: low end: South…
Tag: Statistics
NWMLS: Housing Market Already Hibernating for Winter
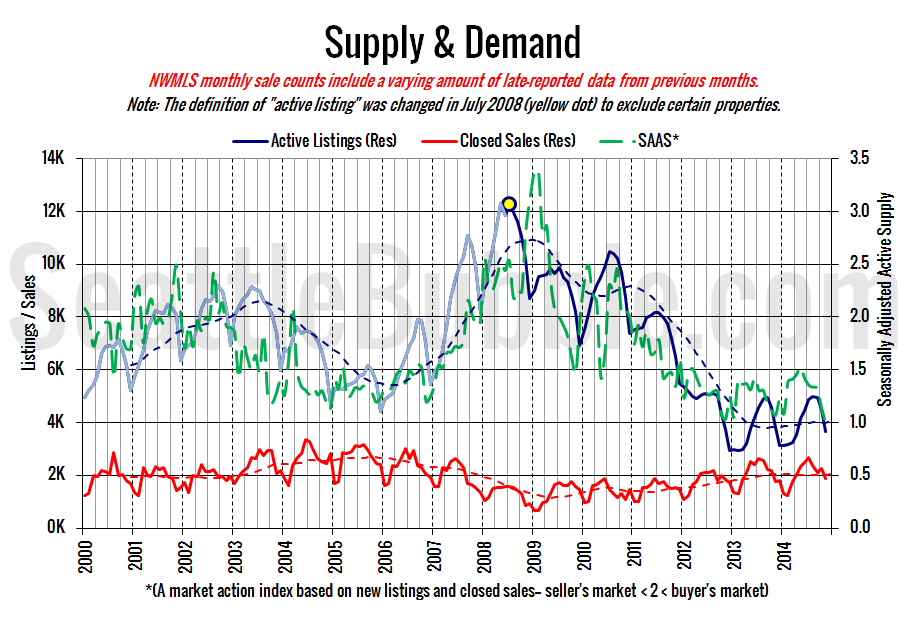
November market stats were published by the NWMLS today. They haven’t published their press release to its typical location yet [update: it has been posted now], so let’s just dive right into our usual monthly stats. CAUTION NWMLS monthly reports include an undisclosed and varying number ofsales from previous months in their pending and closed…
November Stats Preview: Already Winter Edition
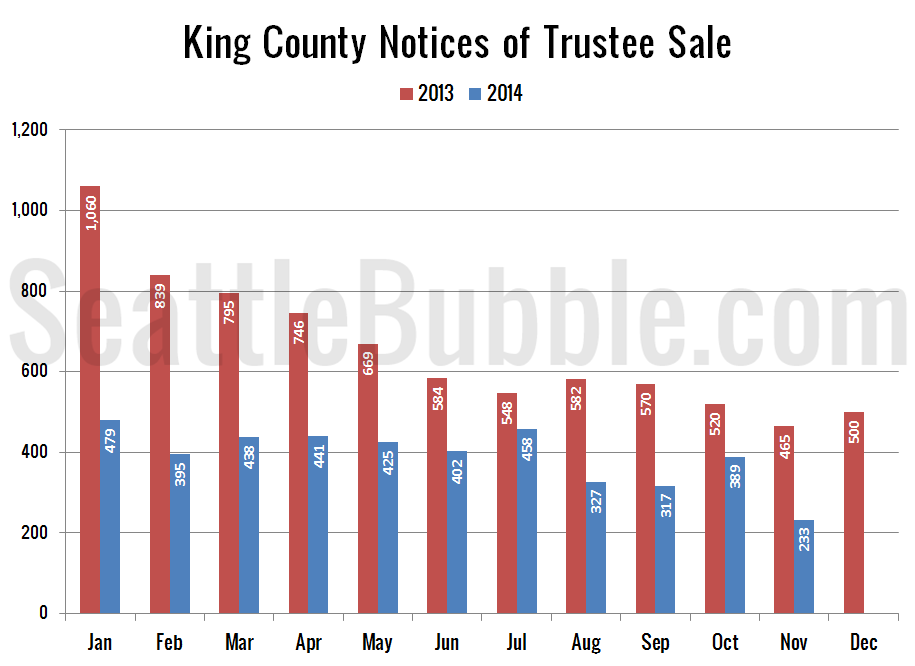
With November now behind us, let’s have a look at our monthly stats preview. Most of the charts below are based on broad county-wide data that is available through a simple search of King County and Snohomish County public records. If you have additional stats you’d like to see in the preview, drop a line…
Case Shiller Tiers: High Tier Declining Alone
Let’s check out the three price tiers for the Seattle area, as measured by Case-Shiller. Remember, Case-Shiller’s “Seattle” data is based on single-family home repeat sales in King, Pierce, and Snohomish counties. Note that the tiers are determined by sale volume. In other words, 1/3 of all sales fall into each tier. For more details…
Case-Shiller: Home Prices Slip Further Into Fall
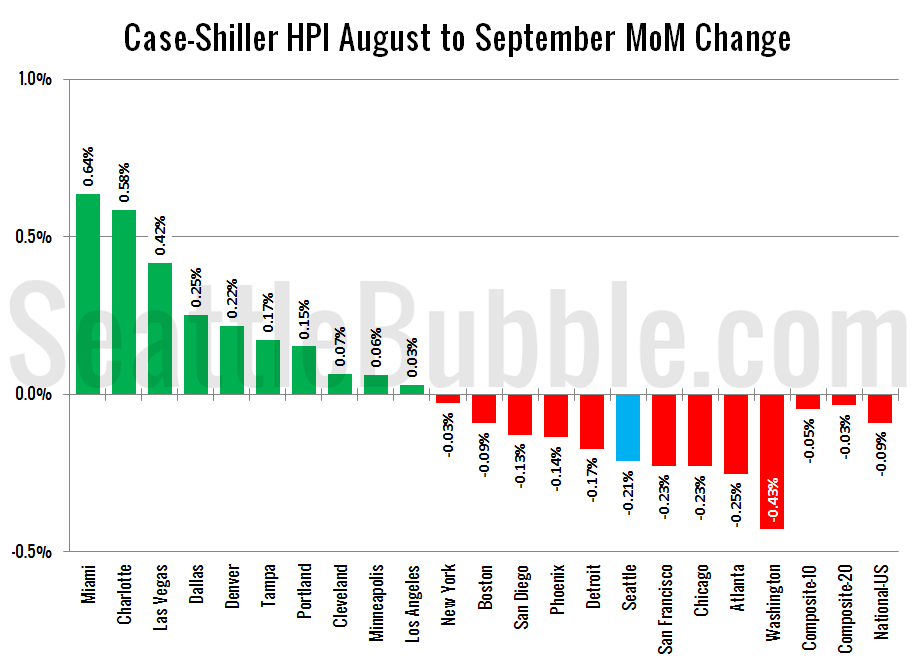
Let’s have a look at the latest data from the Case-Shiller Home Price Index. According to September data, Seattle-area home prices were: Down 0.2% August to September Up 6.0% YOY. Down 11.3% from the July 2007 peak Last year at this time prices were still rising. They increased 0.3% from August to September and year-over-year…


