Skip to content

Seattle Bubble

local real estate news, statistics, and commentary without the sales spin.

Menu
  • Home
  • About
  • Contact
  • Reference
  • Speaking
Menu

Tag: Statistics

November Stats Preview: Slumping Sales Edition

Posted on December 3, 2013December 3, 2013 by The Tim

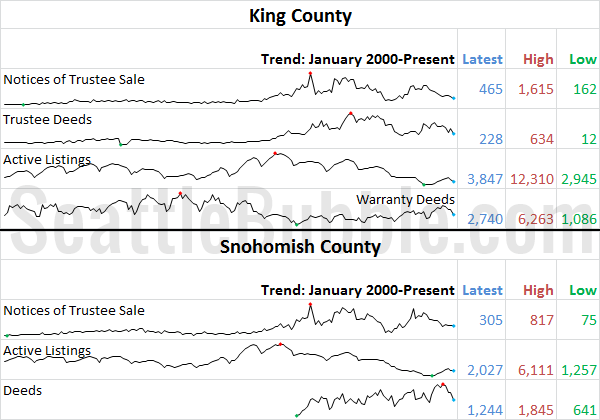
Now that November is behind us, let’s have a look at our stats preview. Most of the charts below are based on broad county-wide data that is available through a simple search of King County and Snohomish County public records. If you have additional stats you’d like to see in the preview, drop a line…

Share:

  • Twitter
  • LinkedIn
  • Facebook
  • Reddit
  • Pinterest
  • Email

Case-Shiller Tiers: Low Tier Strongest in September

Posted on November 27, 2013November 27, 2013 by The Tim

Let’s check out the three price tiers for the Seattle area, as measured by Case-Shiller. Remember, Case-Shiller’s “Seattle” data is based on single-family home repeat sales in King, Pierce, and Snohomish counties. Note that the tiers are determined by sale volume. In other words, 1/3 of all sales fall into each tier. For more details…

Share:

  • Twitter
  • LinkedIn
  • Facebook
  • Reddit
  • Pinterest
  • Email

Case-Shiller: Home Price Gains Stall in September

Posted on November 26, 2013November 29, 2013 by The Tim

Let’s have a look at the latest data from the Case-Shiller Home Price Index. According to September data, Seattle-area home prices were: Up 0.3% August to September Up 13.2% YOY. Down 16.3% from the July 2007 peak Last year prices rose 0.3% from August to September and year-over-year prices were up 4.8%. Nothing really noteworthy…

Share:

  • Twitter
  • LinkedIn
  • Facebook
  • Reddit
  • Pinterest
  • Email

Fewer Pending Sales Failed to Close in Q3

Posted on November 18, 2013 by The Tim

Let’s take a look a the latest data on pending sales volume versus closed sales volume. For this series I roll the pending sales and closed sales data up by quarter, with pending sales offset by one month. In other words, the third quarter numbers below represent pending sales from June, July, and August and…

Share:

  • Twitter
  • LinkedIn
  • Facebook
  • Reddit
  • Pinterest
  • Email

October Home Prices Dip Most in Low Tier Neighborhoods

Posted on November 11, 2013November 11, 2013 by The Tim

It’s time once again to take an updated look at how King County’s sales are shifting between the different regions around the county, since geographic shifts can and do affect the median price. In order to explore this concept, we break King County down into three regions, based on the NWMLS-defined “areas”: low end: South…

Share:

  • Twitter
  • LinkedIn
  • Facebook
  • Reddit
  • Pinterest
  • Email

Posts navigation

  • Previous
  • 1
  • …
  • 48
  • 49
  • 50
  • 51
  • 52
  • 53
  • 54
  • …
  • 134
  • Next

Tim’s Other Projects

Dispatches from the Multiverse

Tip Jar

Like what we're doing?

Drop us a tip!

Accounts

  • Log in
  • Entries feed
  • Comments feed
  • WordPress.org
©2024 Seattle Bubble | Built using WordPress and Responsive Blogily theme by Superb