Skip to content

Seattle Bubble

local real estate news, statistics, and commentary without the sales spin.

Menu
  • Home
  • About
  • Contact
  • Reference
  • Speaking
Menu

Tag: Statistics

Redfin: Seattle-Area Prices Creep Up Through Spring

Posted on June 11, 2012 by The Tim

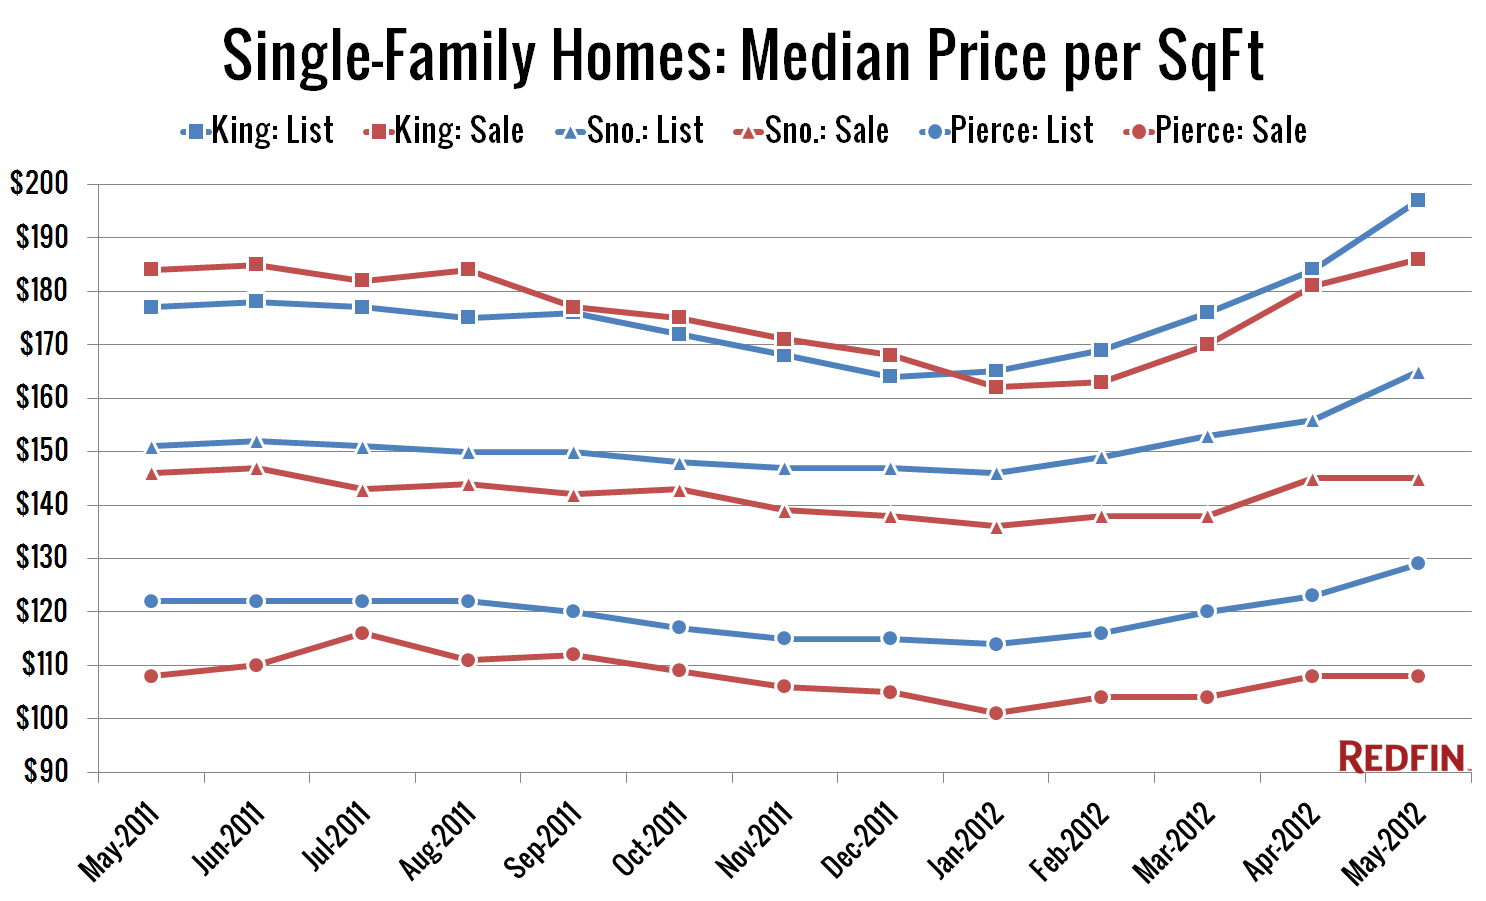
Full disclosure: The Tim is employed by Redfin. It’s been quite a while since I’ve posted any of the monthly market stats published by my employer, but since I’ve been spending a lot more time than usual knee-deep in these spreadsheets lately, I thought I’d share a few charts from the May update (xls). First…

Share:

  • Twitter
  • LinkedIn
  • Facebook
  • Reddit
  • Pinterest
  • Email

May Stats Preview: Not Really a Preview Edition

Posted on June 6, 2012June 6, 2012 by The Tim

Granted, I missed the pre-NWMLS stats window, but I’d still like to post the stats preview charts for May. Most of the charts below are based on broad county-wide data that is available through a simple search of King County and Snohomish County public records. If you have additional stats you’d like to see in…

Share:

  • Twitter
  • LinkedIn
  • Facebook
  • Reddit
  • Pinterest
  • Email

NWMLS: Closed Sales Finally Break Back Above 2,000

Posted on June 4, 2012 by The Tim

May market stats were just released by the NWMLS. Two big firsts in this month’s data. The first month-to-month increase in inventory so far this year and the first time closed sales of single-family houses broke 2,000 in King County since August 2007. Now we finally know: Greg Perry’s 2009 prediction was just 3 years…

Share:

  • Twitter
  • LinkedIn
  • Facebook
  • Reddit
  • Pinterest
  • Email

Case-Shiller Tiers: Low Tier Drags Seattle Index Down

Posted on May 30, 2012May 30, 2012 by The Tim

Let’s check out the three price tiers for the Seattle area, as measured by Case-Shiller. Remember, Case-Shiller’s “Seattle” data is based on single-family home repeat sales in King, Pierce, and Snohomish counties. Note that the tiers are determined by sale volume. In other words, 1/3 of all sales fall into each tier. For more details…

Share:

  • Twitter
  • LinkedIn
  • Facebook
  • Reddit
  • Pinterest
  • Email

Case-Shiller: Home Prices Hit Predictable Spring Bounce

Posted on May 29, 2012 by The Tim

Let’s have a look at the latest data from the Case-Shiller Home Price Index. According to March data, Seattle-area home prices were: Up 1.7% February to March. Down 1.3% YOY. Down 31.8% from the July 2007 peak Last year prices rose 0.1% from February to March and year-over-year prices were down 7.5%. I stand by…

Share:

  • Twitter
  • LinkedIn
  • Facebook
  • Reddit
  • Pinterest
  • Email

Posts navigation

  • Previous
  • 1
  • …
  • 67
  • 68
  • 69
  • 70
  • 71
  • 72
  • 73
  • …
  • 134
  • Next

Tim’s Other Projects

Dispatches from the Multiverse

Tip Jar

Like what we're doing?

Drop us a tip!

Accounts

  • Log in
  • Entries feed
  • Comments feed
  • WordPress.org
©2024 Seattle Bubble | Built using WordPress and Responsive Blogily theme by Superb