Skip to content

Seattle Bubble

local real estate news, statistics, and commentary without the sales spin.

Menu
  • Home
  • About
  • Contact
  • Reference
  • Speaking
Menu

Tag: Tableau

Downtown Seattle Housing Interactive

Posted on November 29, 2013 by The Tim

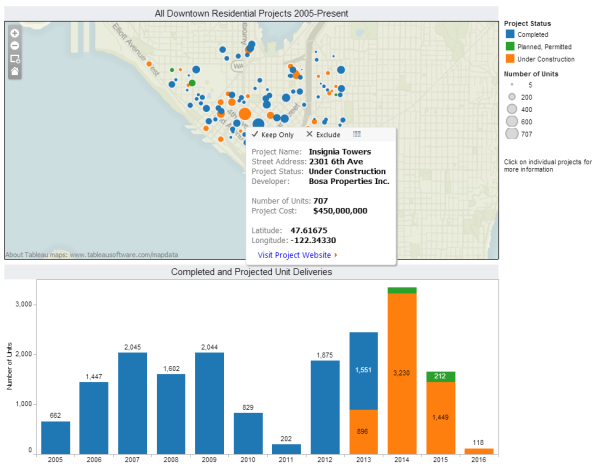
Elliott Krivenko, a Research Specialist with the Downtown Seattle Association sent me this great interactive that he made showing detailed information about all the residential projects in downtown Seattle from 2005 through the present. Click on the image to jump to their website for the interactive (which won’t fit on the page here). One interesting…

Share:

  • Twitter
  • LinkedIn
  • Facebook
  • Reddit
  • Pinterest
  • Email

Case-Shiller: Home Price Gains Stall in September

Posted on November 26, 2013November 29, 2013 by The Tim

Let’s have a look at the latest data from the Case-Shiller Home Price Index. According to September data, Seattle-area home prices were: Up 0.3% August to September Up 13.2% YOY. Down 16.3% from the July 2007 peak Last year prices rose 0.3% from August to September and year-over-year prices were up 4.8%. Nothing really noteworthy…

Share:

  • Twitter
  • LinkedIn
  • Facebook
  • Reddit
  • Pinterest
  • Email

Foreclosures Mixed in October

Posted on November 15, 2013November 15, 2013 by The Tim

It’s time for our detailed look at October ‘s foreclosure stats in King, Snohomish, and Pierce counties. First up, the Notice of Trustee Sale summary: October 2013 King: 520 NTS, down 43% YOY Snohomish: 318 NTS, down 41% YOY Pierce: 464 NTS, down 28% YOY The number of trustee sale notices decreased month-over-month in King…

Share:

  • Twitter
  • LinkedIn
  • Facebook
  • Reddit
  • Pinterest
  • Email

Seattle Price Gains Slowest of Case-Shiller Cities in August

Posted on October 29, 2013October 29, 2013 by The Tim

Let’s have a look at the latest data from the Case-Shiller Home Price Index. According to August data, Seattle-area home prices were: Up 0.5% July to August Up 13.2% YOY. Down 16.6% from the July 2007 peak Last year prices fell 0.1% from July to August and year-over-year prices were up 3.4%. Although the month-over-month…

Share:

  • Twitter
  • LinkedIn
  • Facebook
  • Reddit
  • Pinterest
  • Email

Seattle-Area Foreclosures Fell Again in September

Posted on October 10, 2013October 10, 2013 by The Tim

It’s time for our detailed look at September’s foreclosure stats in King, Snohomish, and Pierce counties. First up, the Notice of Trustee Sale summary: September 2013 King: 570 NTS, down 32% YOY Snohomish: 311 NTS, down 34% YOY Pierce: 425 NTS, down 35% YOY The number of trustee sale notices decreased month-over-month in all three…

Share:

  • Twitter
  • LinkedIn
  • Facebook
  • Reddit
  • Pinterest
  • Email

Posts navigation

  • Previous
  • 1
  • …
  • 13
  • 14
  • 15
  • 16
  • 17
  • 18
  • 19
  • …
  • 46
  • Next

Tim’s Other Projects

Dispatches from the Multiverse

Tip Jar

Like what we're doing?

Drop us a tip!

Accounts

  • Log in
  • Entries feed
  • Comments feed
  • WordPress.org
©2024 Seattle Bubble | Built using WordPress and Responsive Blogily theme by Superb