It’s time once again to expand on our preview of foreclosure activity with a more detailed look at June’s stats in King, Snohomish, and Pierce counties. First up, the Notice of Trustee Sale summary: June 2012 King: 645 NTS, down 30.2% YOY Snohomish: 388 NTS, down 16.2% YOY Pierce: 407 NTS, down 25.3% YOY Still…
Tag: Tableau
Case-Shiller: Spring Accelerates for Seattle Home Prices
Let’s have a look at the latest data from the Case-Shiller Home Price Index. According to April data, Seattle-area home prices were: Up 2.0% March to April. Down 1.0% YOY. Down 30.4% from the July 2007 peak Last year prices rose 1.6% from March to April and year-over-year prices were down 6.9%. Inching ever closer…
The Seattle-Area’s Most Expensive Zip Code Is…
00
Case-Shiller: Home Prices Hit Predictable Spring Bounce
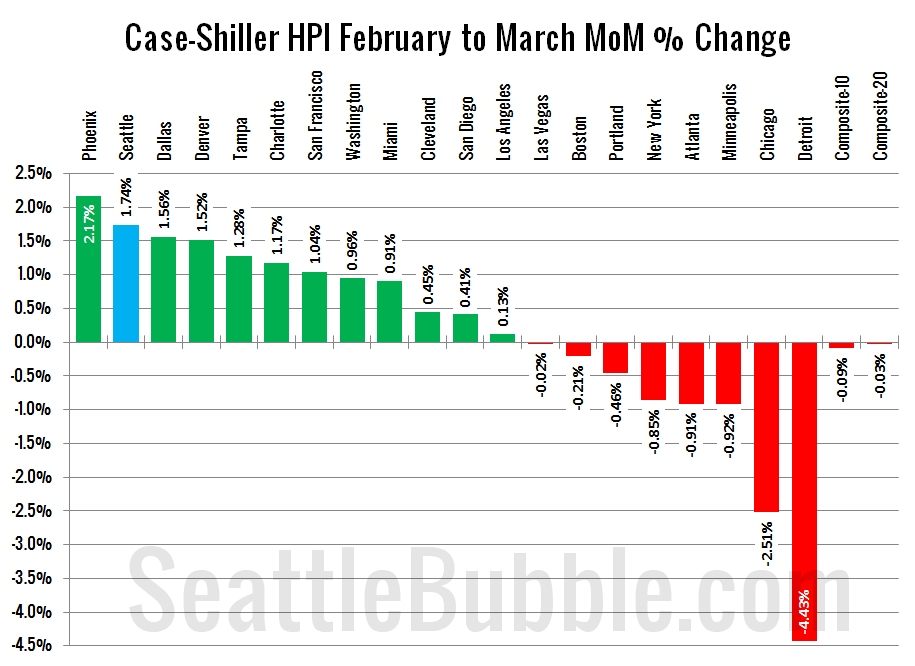
Let’s have a look at the latest data from the Case-Shiller Home Price Index. According to March data, Seattle-area home prices were: Up 1.7% February to March. Down 1.3% YOY. Down 31.8% from the July 2007 peak Last year prices rose 0.1% from February to March and year-over-year prices were down 7.5%. I stand by…
Foreclosures Dip in April, Continue Yearly Drop
It’s time once again to expand on our preview of foreclosure activity with a more detailed look at April’s stats in King, Snohomish, and Pierce counties. First up, the Notice of Trustee Sale summary: April 2012 King: 441 NTS, down 51.6% YOY Snohomish: 275 NTS, down 49.7% YOY Pierce: 267 NTS, down 55.6% YOY Slightly…
