Let’s check in on the NWMLS statistics from around the sound.
Here’s where the YOY stats stand for each of the six counties as of October 2008:
King – Price: -11.7% | Listings: +2.7% | Sales: -22.4% | MOS: 8.3
Snohomish – Price: -10.8% | Listings: -6.0% | Sales: -28.0% | MOS: 10.9
Pierce – Price: -9.2% | Listings: -12.1% | Sales: -12.3% | MOS: 9.4
Kitsap – Price: -11.4% | Listings: -6.8% | Sales: -19.7% | MOS: 9.3
Thurston – Price: -0.3% | Listings: -7.5% | Sales: -20.9% | MOS: 7.7
Island – Price: -3.4% | Listings: +1.7% | Sales: -27.1% | MOS: 17.5
Skagit – Price: -0.6% | Listings: +2.0% | Sales: -48.1% | MOS: 16.2
These graphs only represent the market action since January 2006. If you want to see the long-term trends, feel free to download the spreadsheet (or in Excel 2003 format) that all of these graphs come from, and adjust the x-axis to your liking. Also included in the spreadsheet is data for Whatcom County, for anyone up north that might be interested.
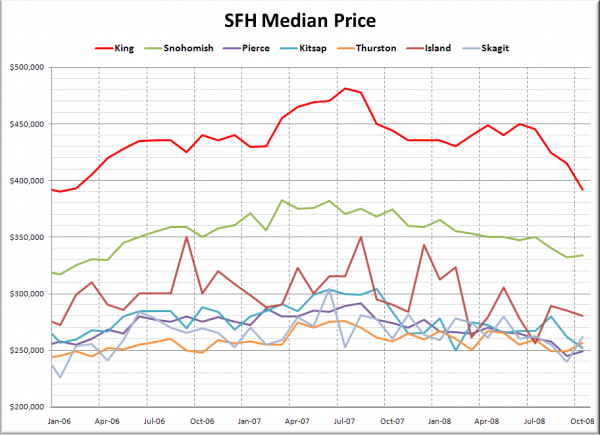
First up, it’s raw median prices.
Median prices actually increased month-to-month in Snohomish, Pierce, Thurston and Skagit counties, while declining in King, Kitsap, and Island. King’s drop was the largest, falling $23,000 in one month.
Here’s how each of the counties look compared to their peak:
King – Peak: July 2007 | Down 18.5%
Snohomish – Peak: March 2007 | Down 12.7%
Pierce – Peak: August 2007 | Down 14.6%
Kitsap – Peak: September 2007 | Down 17.3%
Thurston – Peak: July 2007 | Down 6.9%
Island – Peak: August 2007 | Down 20.0%
Skagit – Peak: June 2007 | Down 14.0%
Island County has taken the lead with the largest total drop right at 20%, with King not far behind at 18.5% Much in the same way that the Seattle area did not rise as much as other parts of the country, and will likely not fall as far, the outlying Seattle-area counties also did not rise as much, and are so far tending not to fall as much. Note that the spreadsheet also contains a “drop from peak” graph, similar to the one posted with the monthly Case-Shiller update.
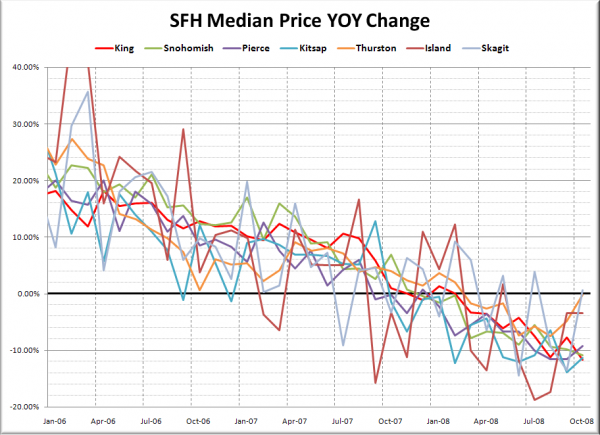
Here’s another take on Median Prices, looking at the year-to-year changes over the last two years.
The ever-volitile Skagit County actually bumped back into slightly positive YOY territory in October, registering a 0.6% gain. Drops in the remaining Puget Sound counties ranged from just 0.3% in Thurston to 11.7% in King.
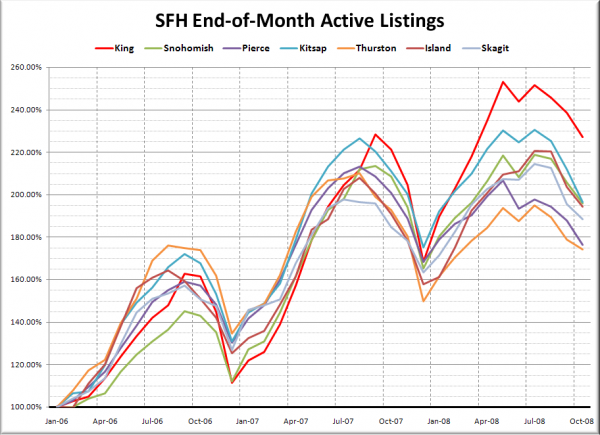
Here’s the graph of listings for each county, indexed to January 2006.
Nothing too surprising here, with King County still separated from the bunch, having over 220% as many homes on the market at the end of October 2008 than in January 2006. No other county registered above 200%.
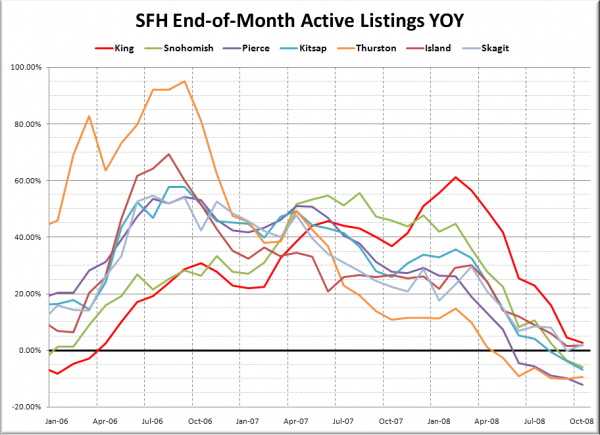
Here’s a look at the YOY change in listings.
King, Island, and Skagit counties all registered very slight year-over-year inventory growth, while Snohomish, Pierce, Kitsap, and Thurston dipped between 6% and 12%.
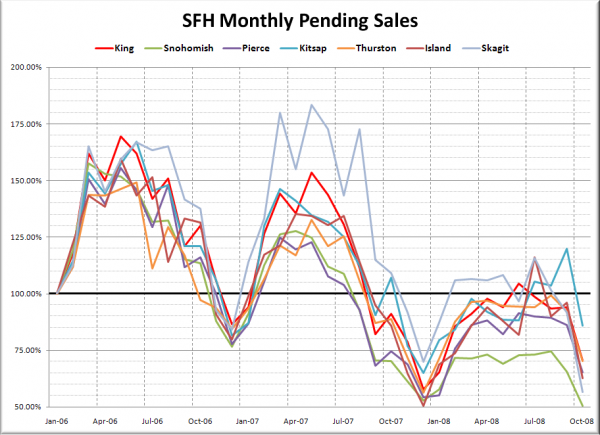
Pending sales, also indexed to January 2006:
After the unusual boost in September sales, every county experienced a sharp decline in October. The drop in Snohomish County put their October sales at barely over half as many sales as January 2006.
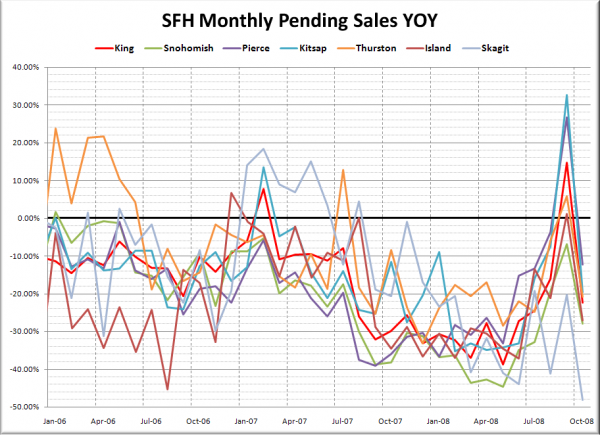
Lastly, here’s the YOY graph of sales:
The September to October drop in sales is even more dramatic on the year-to-year graph, making it abundently clear that September’s sales spike was nothing more than an aberration.
None of the counties look particularly strong heading into what is typically the slow season for real estate. It seems likely at this point that before the spring “sales season” hits, price declines from peak may reach 25% across the board.
