November market stats have been published by the NWMLS. Here’s the NWMLS press release: Move-up buyers, extended/expanded tax credits boost home sales; Northwest MLS brokers expect momentum to continue in 2010.
Here’s your King County SFH summary, with the arrows to show whether the year-over-year direction of each indicator is favorable or unfavorable news for buyers and sellers (green = favorable, red = unfavorable):
| November 2009 | Number | MOM | YOY | Buyers | Sellers |
| Active Listings | 8,218 | -7.3% | -19.2% |  |
 |
| Closed Sales | 1,574 | -10.5% | +81.1% |  |
 |
| SAAS (?) | 1.48 | -8.5% | -47.6% |  |
 |
| Pending Sales | 1,581 | -31.1% | +35.9% |  |
 |
| Months of Supply | 5.2 | +34.5% | -40.6% |  |
 |
| Median Price* | $370,000 | -2.0% | -6.3% |  |
 |
The 2000-2007 average decline in closed sales from October to November was 12.8%, at 10.5%, the fake expiration of the tax credit did not boost November closings quite as much as I was expecting. Could it be that the strength of the tax credit was already wearing off before they even decided to extend it?
It is interesting to note that after spending the previous seven months in excess of 2,000, pending sales dropped through the floor in November, taking the largest one-month tumble on record. The average October to November drop in pending sales 2000-2008 is 13.7. Contrast that with 2009’s 31.1% drop. (Here’s a chart from the Seattle Bubble Spreadsheet for those month-to-month numbers.) Not too surprising considering that November pendings would have been too late to qualify under the old tax credit deadline, and there is no urgency anymore to rush to beat the new deadline.
As we head into winter, I’m comfortable now calling the winners in May’s poll: Guess the maximum 1-month total closed SFH sales in King Co. for 2009. 1,750-2,000 takes the prize. Only 12 of 123 voters selected the correct answer. Congratulations to deejayoh and me, as well as four other registered commenters.
I don’t have access to my full spreadsheets at the moment, so I’ll update this post later today with the charts and updated spreadsheet download link. Post updated.
Feel free to download the updated Seattle Bubble Spreadsheet, and here’s a copy in Excel 2003 format. Click below for the rest of the usual monthly graphs.
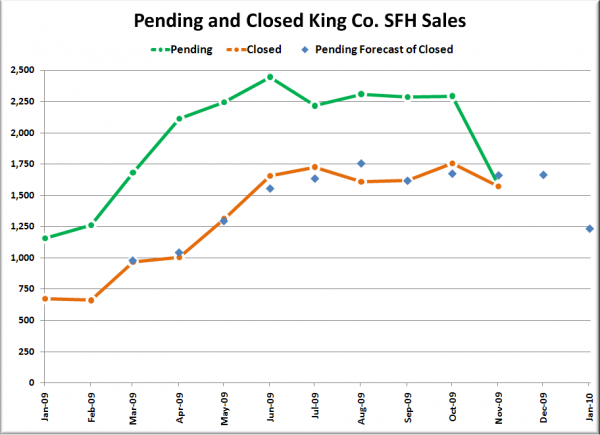
Here’s a look at pending sales, closed sales, and a forecast of the next two months of closed sales that assumes the relationship seen between the two over the previous nine months continues (which is an admittedly dangerous assumption given the phoney November closing deadline of the tax credit).
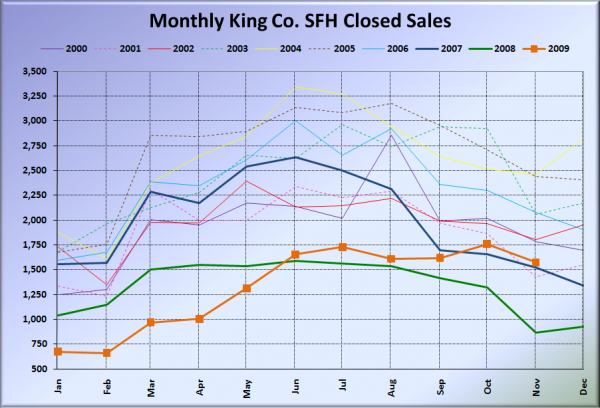
Here’s how the closed sales situation is shaping up compared to previous years:
Not much of a deviation from the usual seasonal decline this time around. Certainly a much stronger showing than a year ago, but four other years actually had smaller month-to-month percentage declines from October to November.
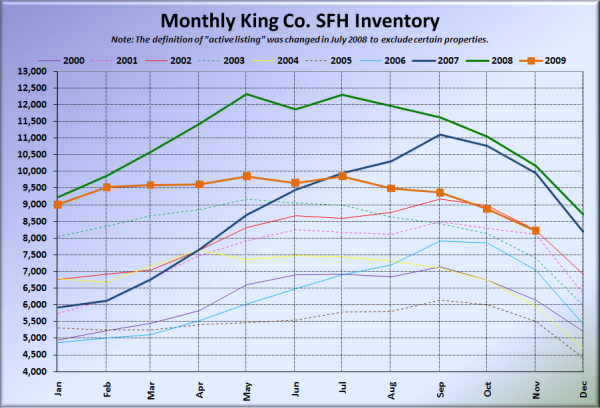
Here’s the graph of inventory with each year overlaid on the same chart.
Still following the usual seasonal pattern, coming in as one of the highest years on record, higher than every year from 2000 through 2006 except 2002.
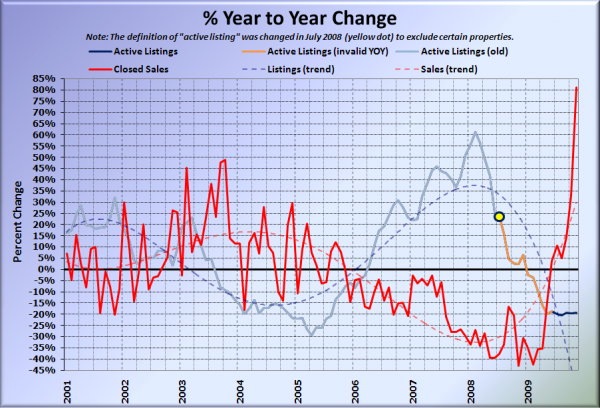
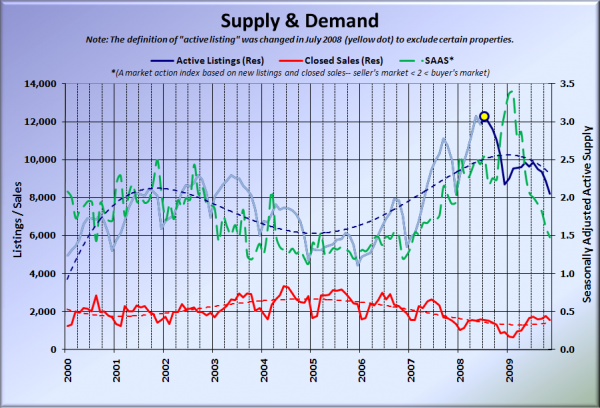
Here’s the supply/demand YOY graph. In place of the now-unreliable measure of pending sales, the “demand” in the following two charts is now represented by closed sales, which have had a consistent definition throughout the decade.
For the first time I actually had to (significantly) adjust the upper bound for the closed sales vertical axis. That’s probably sustainable, right? (sarcasm)
Here’s the chart of supply and demand raw numbers:
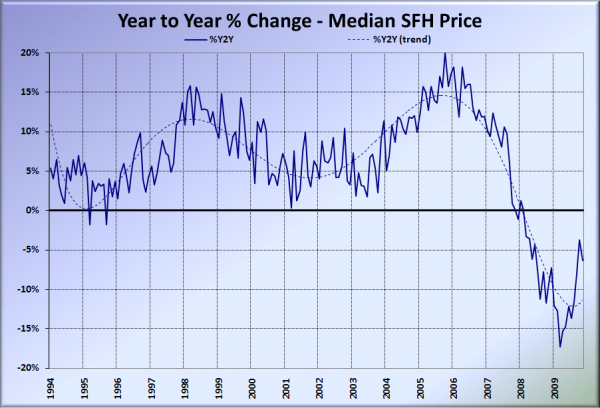
Here’s the median home price YOY change graph:
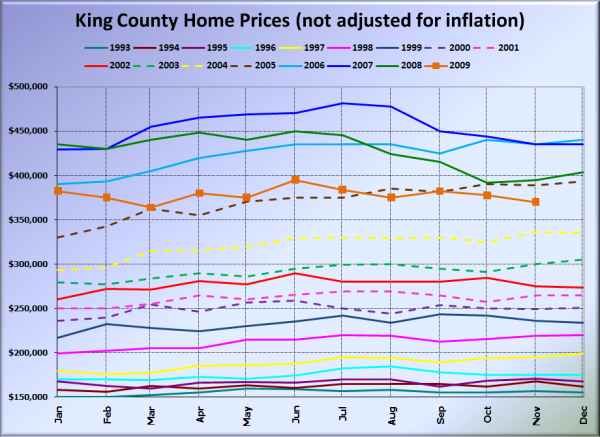
And lastly, here is the chart comparing King County SFH prices each month for every year back to 1994.
Dropped back below May 2005 pricing. May 2005: $370,500. November 2009: $370,000.
Here’s a few news blurbs to hold you over until tomorrow’s reporting roundup.
Seattle Times: Home sales shoot up in November from year ago thanks to federal tax credit
Seattle P-I: House sales up 81% in November, prices down in King County
