For some reason, a couple weeks ago the Seattle Times website featured a syndicated article about RealtyTrac’s “Vampire REO” nonsense, which in addition to being a completely worthless bit of non-news, was already weeks old when it appeared on the front page of the Seattle Times website.
In the comments to the article I did my best to point out the misleading, sensationalist nature of the RealtyTrac “data.” A commenter going by the name of “IArustic” was not satisfied when I summarized the monthly foreclosure data I post here:
The data shows a reasonable pattern of homes moving through the foreclosure pipeline, with foreclosures peaking in mid-2009 and generally declining since then.
The number of homes coming out the end of the foreclosure pipeline (via Trustee Deeds and subsequent MLS sales) has moved in proportion to the number of homes coming in (via Notices of Trustee Sale). There is no evidence to suggest a growing number of homes being stuck in the process nor a giant backlog of “shadow inventory” that will burst forth any day now and collapse the housing market.
In response, IArustic argued that:
Your monthly posts track the notices of sale, but not the MLS foreclosure sales, that I can see. I don’t see the data for your proportional claim.
…
I’m not arguing so much as asking a data guy to show me the data.
Ideally what we would be able to do is look at how many homes hit each stage of the foreclosure pipeline (described in detail in this post) over a long period of time, rolled up by month. Unfortunately notices of default are not public record in Washington, so we can’t get that data, but thanks to my old friends at the technology-powered brokerage Redfin, I was able to get counts of actual foreclosures, MLS listings of bank-owned homes (REO), and REO sales.
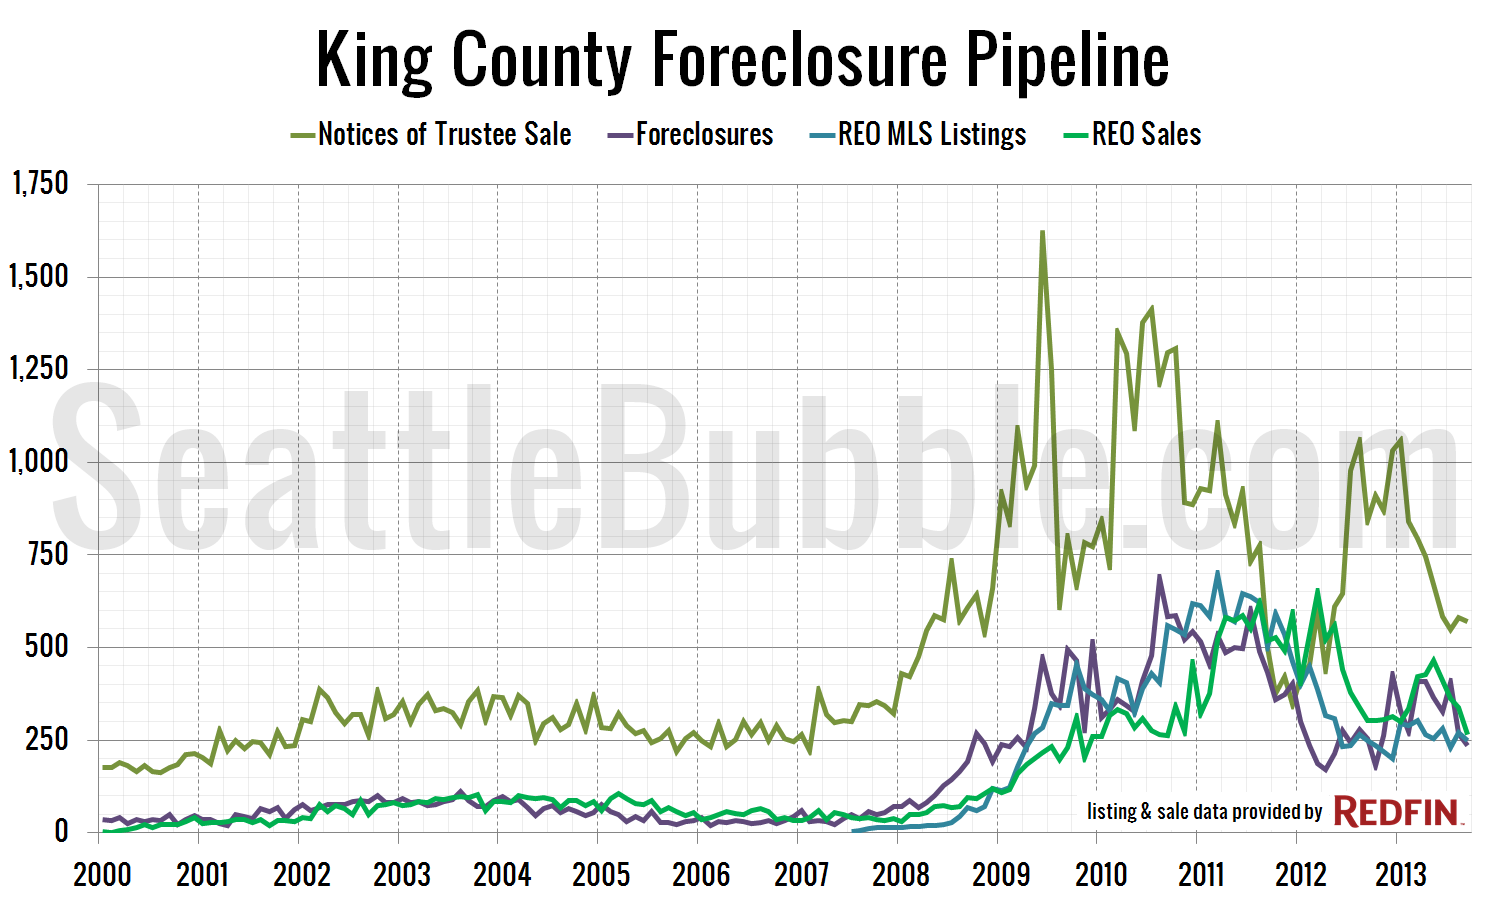
Here’s what the pipeline looks like in King County since January 2000:
As you can see, it’s exactly what I described in the Seattle Times comment thread. Foreclosures, MLS listings of REOs, and subsequent sales of REOs have moved in direct proportion to notices of trustee sale (NTS) throughout the entirety of the data I have available.
| 2000-2004 (Pre-Bubble) |
2007-Present (Post-Peak) |
|
|---|---|---|
| NTS Filed | 16,746 | 59,562 |
| Foreclosures | 3,717 | 23,654 |
| Unforeclosed NTS | 78% | 60% |
| REO Sales | 3,401 | 22,126 |
| Unsold REO | 9% | 6% |
The table at right shows a summary of the total number of foreclosures through various stages of the process during the 2000-2004 pre-bubble period and the 2007-present post-bubble period.
Many notices of trustee sale do not translate into an actual foreclosure, because the homeowner is able to get current on their mortgage or because numerous notices are filed on the same home. During the period when home prices were rising at a reasonable rate, roughly 78 percent of notices of trustee sale did not result in a foreclosure. As we would expect when home prices were decreasing, that number dropped to 60 percent, meaning that a notice of trustee sale more often did end in foreclosure.
Only nine percent of foreclosed homes did not appear in the sale stats Redfin pulled for me during the pre-bubble period. During the post-peak period, that number decreased to just six percent.
If banks were intentionally keeping large numbers of foreclosed homes off the market, we would expect to see both of those numbers increase during the post-peak period, not decrease.
Does some amount of shadow inventory exist? Yes.
Are there some homes that are taking years to move through the foreclosure process instead of months? Yes.
Is there a massive backlog of foreclosures being “held back” by the bank, amounting to a huge shadow inventory large enough to have a large effect on the housing market? No. Not in King County, anyway.
The data shows foreclosures being processed in much the same way they always have, and a general decrease in the number of foreclosures since late 2010.
Full disclosure: The Tim is currently a Redfin shareholder.

