December market stats were published by the NWMLS this afternoon. Here’s a snippet from their press release: Year-end gains in inventory, sales, prices.
Brokers with Northwest Multiple Listing Service ended 2013 with the best year-over-year improvement in inventory (up 8.4 percent) and a similar gain in closed sales to buoy confidence heading into the new year. December’s pending sales slipped slightly (down about 1.7 percent) compared to the same month a year ago.
“Positive job growth and the continuation of favorable low interest rates are setting the stage for another good year in real estate,” said J. Lennox Scott, chairman and CEO of John L. Scott Real Estate.
Friday’s narrow approval of Boeing’s contract proposal for Machinists union members bodes well for members of Northwest Multiple Listing Service and the real estate industry.
Reacting to the vote, MLS board member John Deely said, “The robust and diverse economy of the Pacific Northwest is solidified by Boeing’s continued presence in the Seattle area.” Deely, the principal managing broker at Coldwell Banker Bain in Seattle, said the vote helps secure the region’s position as “the aerospace epicenter of the world with top-notch manufacturing jobs that support the industry.”
Boeing workers and others hoping to buy a home have a bigger selection of homes to consider than house-hunters who were looking twelve months ago – especially in Snohomish County, where the number of active listings is up 43.6 percent.
Wow, way to stay classy, NWMLS. Shamelessly attempting to capitalize on the Boeing news was the best you could come up with this month? Yikes. I suppose it’s (slightly) less pitiful than the car salesmen that lurked just onshore last month in Everett waiting to capture freshly-docked Navy “leads.”
On with our usual monthly stats.
NWMLS monthly reports include an undisclosed and varying number of
sales from previous months in their pending and closed sales statistics.
Here’s your King County SFH summary, with the arrows to show whether the year-over-year direction of each indicator is favorable or unfavorable news for buyers and sellers (green = favorable, red = unfavorable):
| December 2013 | Number | MOM | YOY | Buyers | Sellers |
|---|---|---|---|---|---|
| Active Listings | 3,127 | -18.1% | +6.2% |  |
 |
| Closed Sales | 1,794 | +1.1% | +3.0% |  |
 |
| SAAS (?) | 1.22 | +14.1% | -1.5% |  |
 |
| Pending Sales | 1,529 | -25.3% | -5.4% |  |
 |
| Months of Supply | 2.05 | +9.6% | +12.3% |  |
 |
| Median Price* | $419,825 | +1.4% | +10.5% |  |
 |
Feel free to download the updated Seattle Bubble Spreadsheet (Excel 2003 format), but keep in mind the caution above.
The only indicators that isn’t pointing in buyers’ favor is now prices. Inventory, sales, months of supply, and the rest are now all trending toward a buyer’s market.
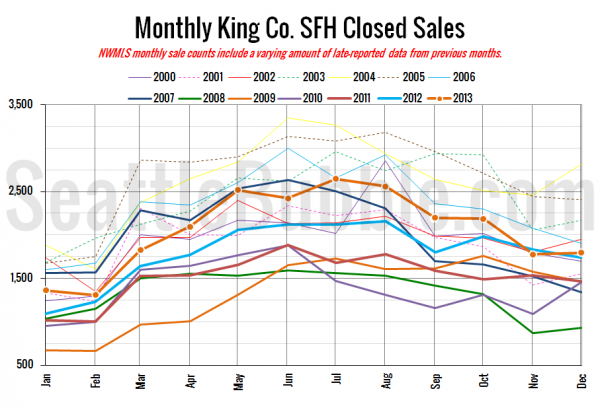
Here’s your closed sales yearly comparison chart:
Closed sales have increased between November and December in 12 of the last 21 years, including this year’s 1.1% increase. The average increase over that period is 8 percent.
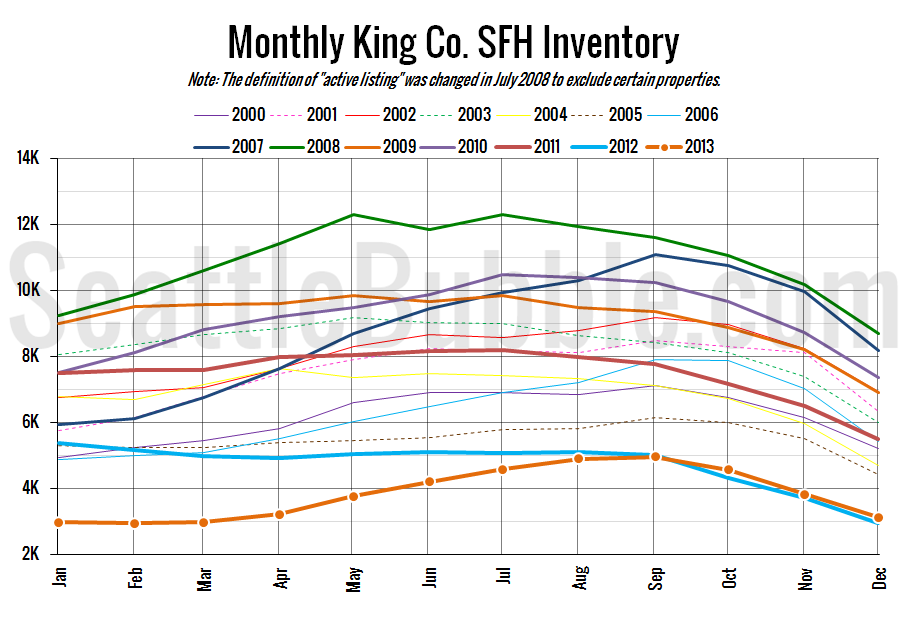
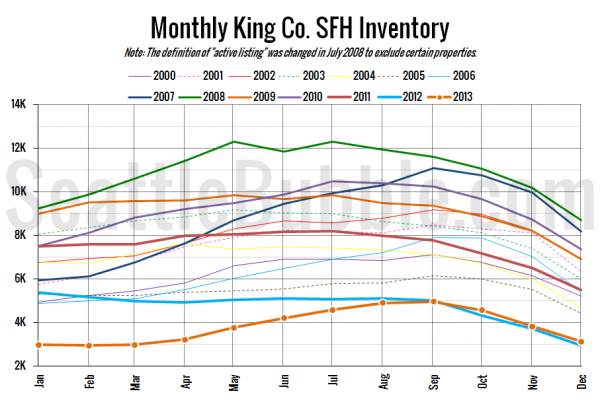
Here’s the graph of inventory with each year overlaid on the same chart.
No surprise here. Between 2000 and 2012, inventory fell an average of 18.2% between November and December, with a standard deviation of just under 3 percentage points. Last year inventory fell 18.1% between November and December, almost dead-on the average.
The year ended with inventory up 6.2%, so congratulations to the 24 of you who voted “up 5% to 10%” in our August poll.
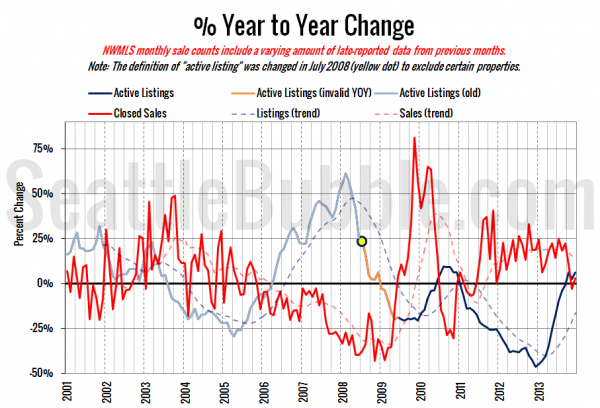
Here’s the supply/demand YOY graph. “Demand” in this chart is represented by closed sales, which have had a consistent definition throughout the decade (unlike pending sales from NWMLS).
The supply trend stayed in the black, while the demand trend inched back into black. I would be surprised if demand stays year-over-year positive in January given that pending sales have been negative for three months in a row.
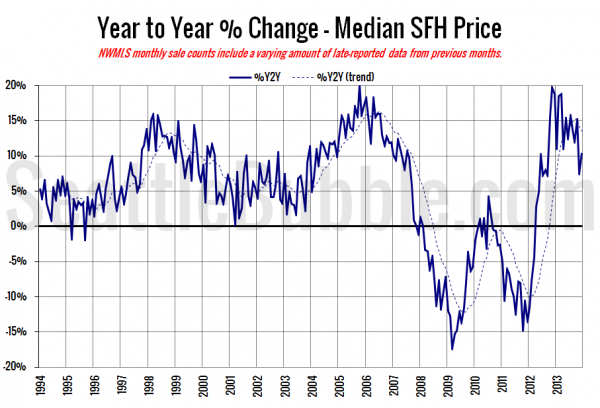
Here’s the median home price YOY change graph:
The median sale price inched back up a bit in December, moving the year-over-year gain back to double digits.
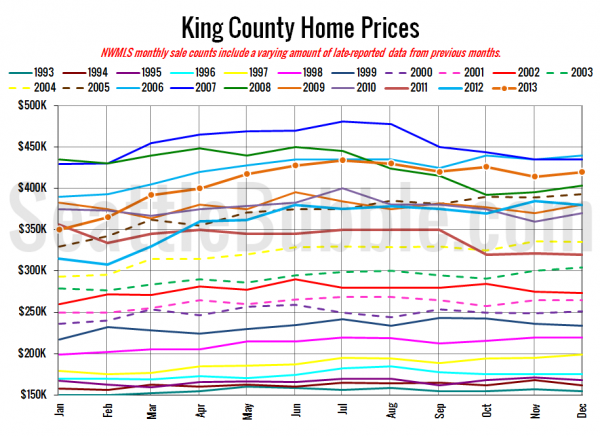
And lastly, here is the chart comparing King County SFH prices each month for every year back to 1994 (not adjusted for inflation).
December 2013: $419,825
April 2006: $419,500
Here are the articles from the Seattle Times and P-I:
Seattle Times: King County home prices rise 10.5 percent for 2013
Seattle P-I: King County still has few homes for sale
Check back tomorrow for the full reporting roundup.
