Let’s have a look at the latest data from the Case-Shiller Home Price Index. According to February data, Seattle-area home prices were:
Up 1.9% February to March
Up 11.6% YOY.
Down 15.7% from the July 2007 peak
Last year prices rose 3.0% from February to March and year-over-year prices were up 10.6%.
Since this year’s seasonal increase was smaller than it was last year, the year-over-year increase shrank a bit between February and March, hitting its lowest point since April 2013.
Here’s an interactive graph of the year-over-year change for all twenty Case-Shiller-tracked cities, courtesy of Tableau Software (check and un-check the boxes on the right):
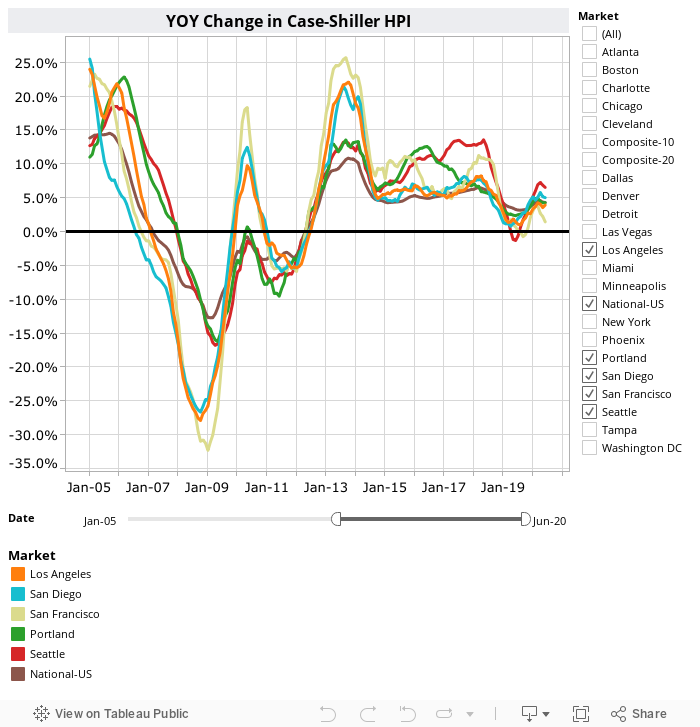
Seattle’s position for month-over-month changes inched up from #3 in February to #2 in March. Only San Francisco saw home prices rise more between February and March than they did in Seattle.

Hit the jump for the rest of our monthly Case-Shiller charts, including the interactive chart of raw index data for all 20 cities.
In March, eight of the twenty Case-Shiller-tracked cities gained more year-over-year than Seattle (one less than February):
- Las Vegas at +21.2%
- San Francisco at +20.9%
- San Diego at +18.9%
- Los Angeles at +16.9%
- Miami at +16.2%
- Atlanta at +15.7%
- Detroit at +15.7%
- Portland at +11.8%
Eleven cities gained less than Seattle as of March: Minneapolis, Chicago, Phoenix, Tampa, Dallas, Denver, Washington DC, Boston, New York, Charlotte, and Cleveland.
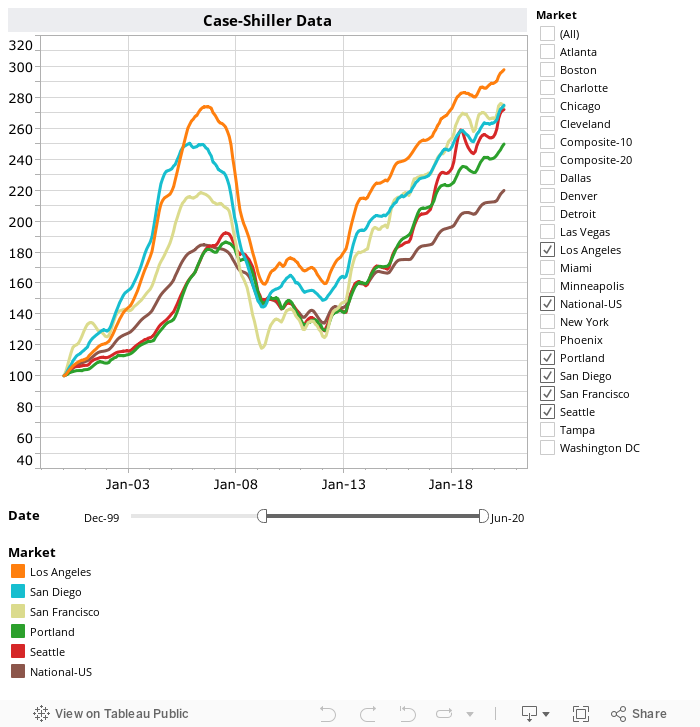
Here’s the interactive chart of the raw HPI for all twenty cities through March.
Here’s an update to the peak-decline graph, inspired by a graph created by reader CrystalBall. This chart takes the twelve cities whose peak index was greater than 175, and tracks how far they have fallen so far from their peak. The horizontal axis shows the total number of months since each individual city peaked.

In the seventy-nine months since the price peak in Seattle prices have declined 15.7%.
Lastly, let’s see what month in the past Seattle’s current prices most compare to. As of March 2014, Seattle prices are right around where they were in October 2005.

Check back tomorrow for a post on the Case-Shiller data for Seattle’s price tiers.
(Home Price Indices, Standard & Poor’s, 05.27.2014)