It’s time once again to take an updated look at how King County’s sales are shifting between the different regions around the county, since geographic shifts can and do affect the median price.
In order to explore this concept, we break King County down into three regions, based on the NWMLS-defined “areas”:
- low end: South County (areas 100-130 & 300-360)
- mid range: Seattle / North County (areas 140, 380-390, & 700-800)
- high end: Eastside (areas 500-600)
Here’s where each region’s median prices came in as of September data:
- low end: $247,500-$428,450
- mid range: $363,500-$725,975
- high end: $467,000-$1,419,000
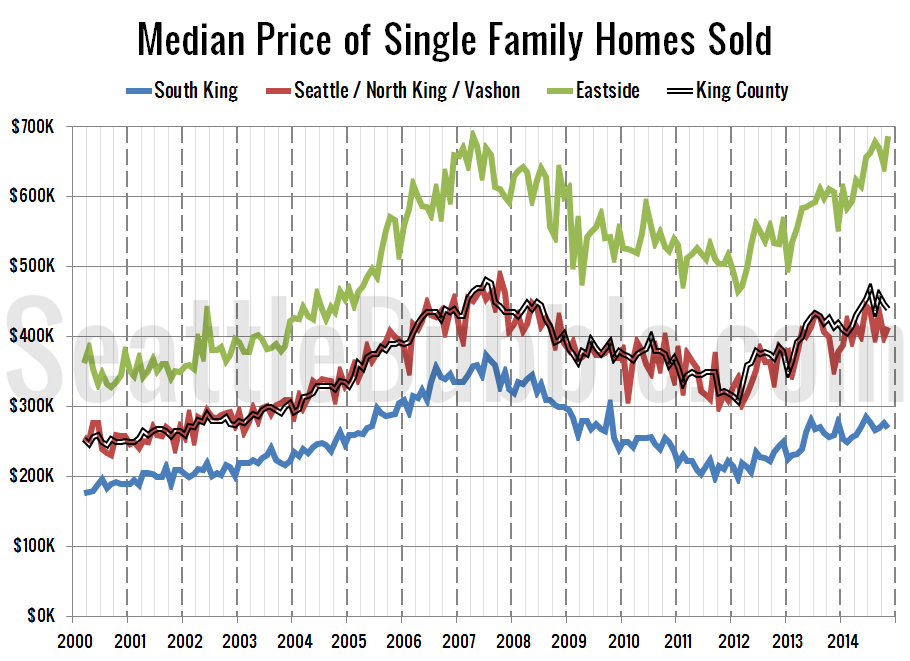
First up, let’s have a look at each region’s (approximate) median price (actually the median of the medians for each area within the region).
It’s hard to tell from that chart, but the median-median in the Eastside regions hit a new all-time high of $687,500 in November. The previous high was $687,225 set in April of 2007. Eastside prices bottomed out in February 2012.
Month-over-month, only the low tier saw the median price fall between October and November. The low tier fell 2.3 percent in the month, the middle tier increased 3.3 percent, and the high tier gained 6.7 percent.
Twenty-three of the twenty-nine NWMLS regions in King County with single-family home sales in November had a higher median price than a year ago, while eighteen had a month-over-month increase in the median price.
Here’s how the median prices changed year-over-year. Low tier: up 4.2 percent, middle tier: up 16.7 percent, high tier: up 13.3 percent.
Next up, the percentage of each month’s closed sales that took place in each of the three regions.
Sales in all three regions fell between October and November, but the mix changed slightly as the expensive Eastside continued to make up less of the total volume.
Year-over-year sales were mixed across the three tiers. Compared to a year ago, sales increased 14.6 percent in the low tier, rose 6.8 percent in the middle tier, and dropped 4.4 percent in the high tier. This is the fourth month in a row of declining sales volumes in the Eastside. It’s possible that is related to the record high home prices I mentioned above.
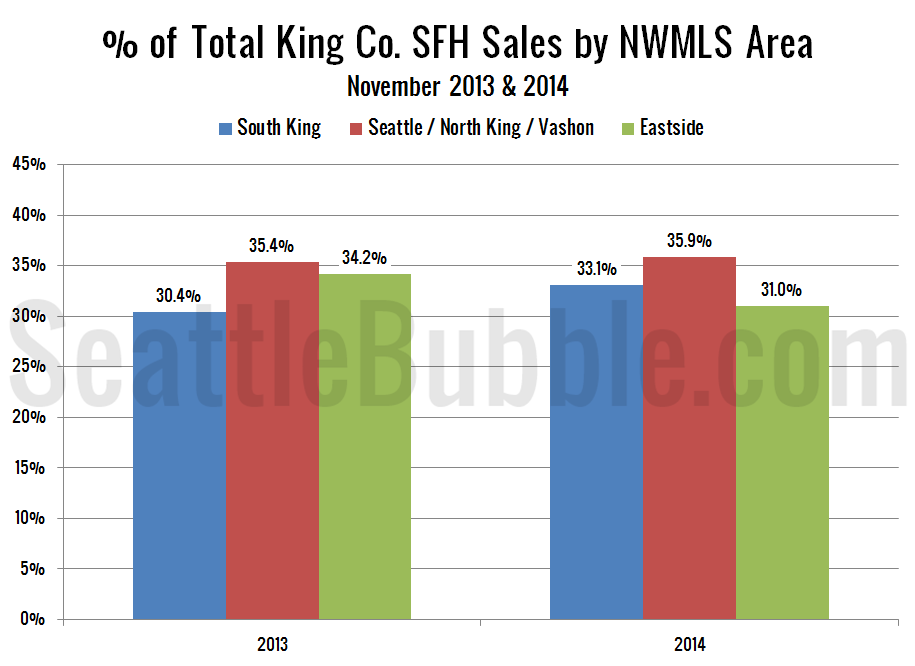
As of November 2014, 33.1 percent of sales were in the low end regions (up from 30.4 percent a year ago), 35.9 percent in the mid range (up slightly from 35.4 percent a year ago), and 31.0 percent in the high end (down from 34.2 percent a year ago).
Here’s that information in a visual format:
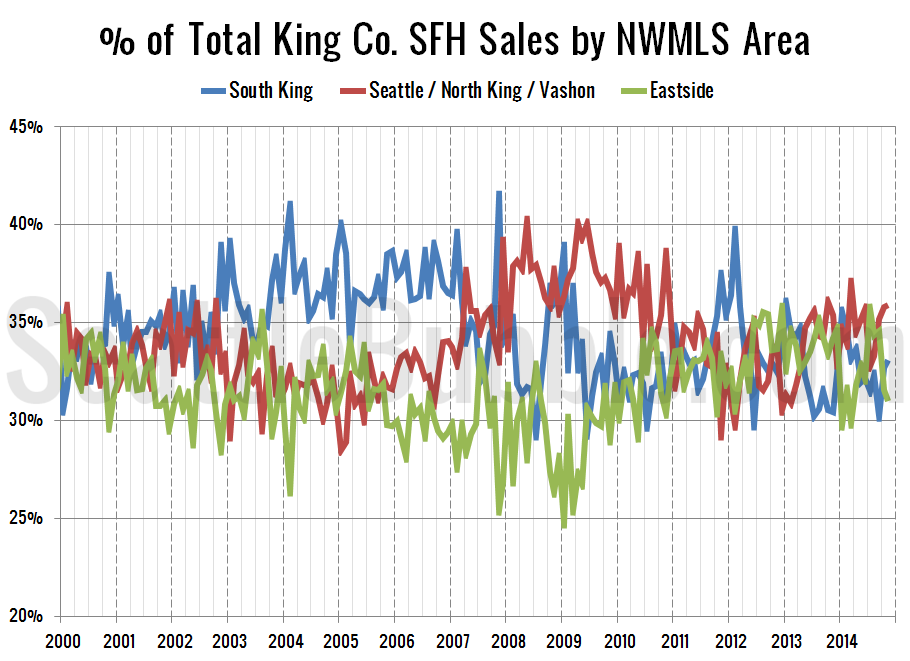
Finally, here’s an updated look at the percentage of sales data all the way back through 2000:
It’s more historically common for the Eastside to make up the smallest share of sales as it does now, but all three tiers are relatively even compared to some of the differences we’ve seen in the past. It’s hard to get a strong read on any big regional shifts with the middling data we’ve seen the last few months.


