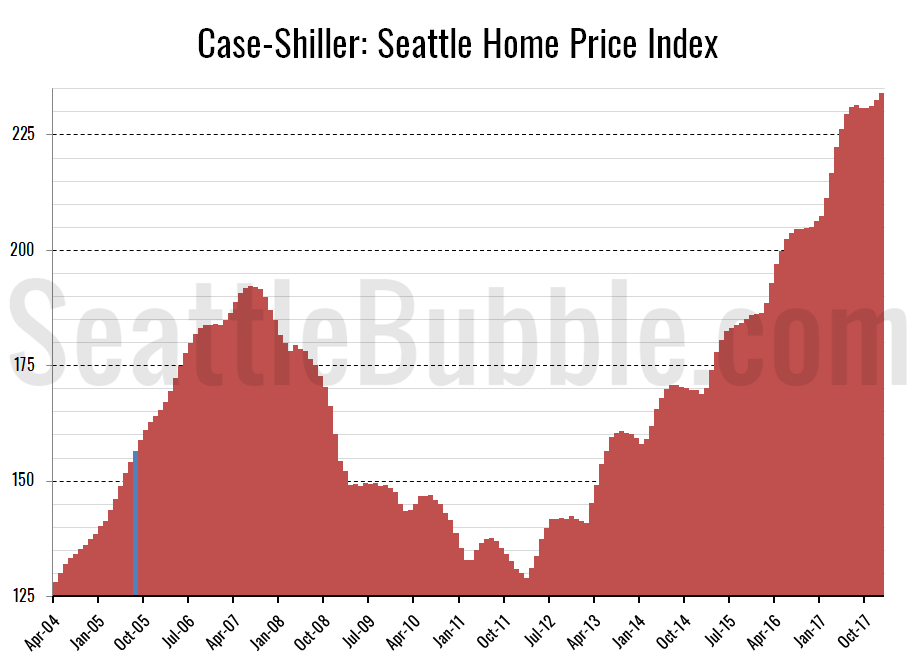
Let’s have a look at the latest data from the Case-Shiller Home Price Index. According to July data that was released today, Seattle-area home prices were:
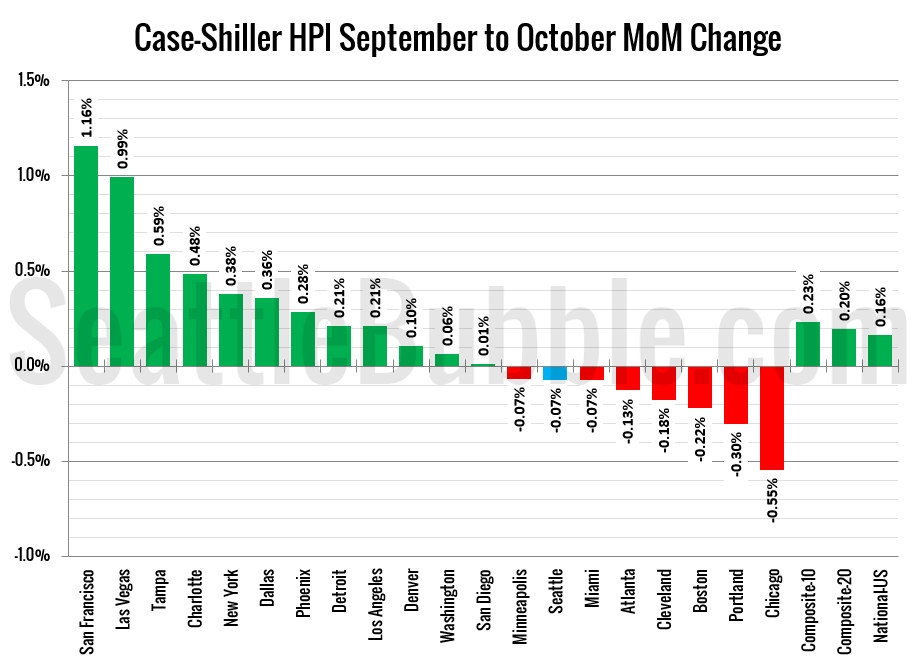
Down less than 0.1 percent June to July
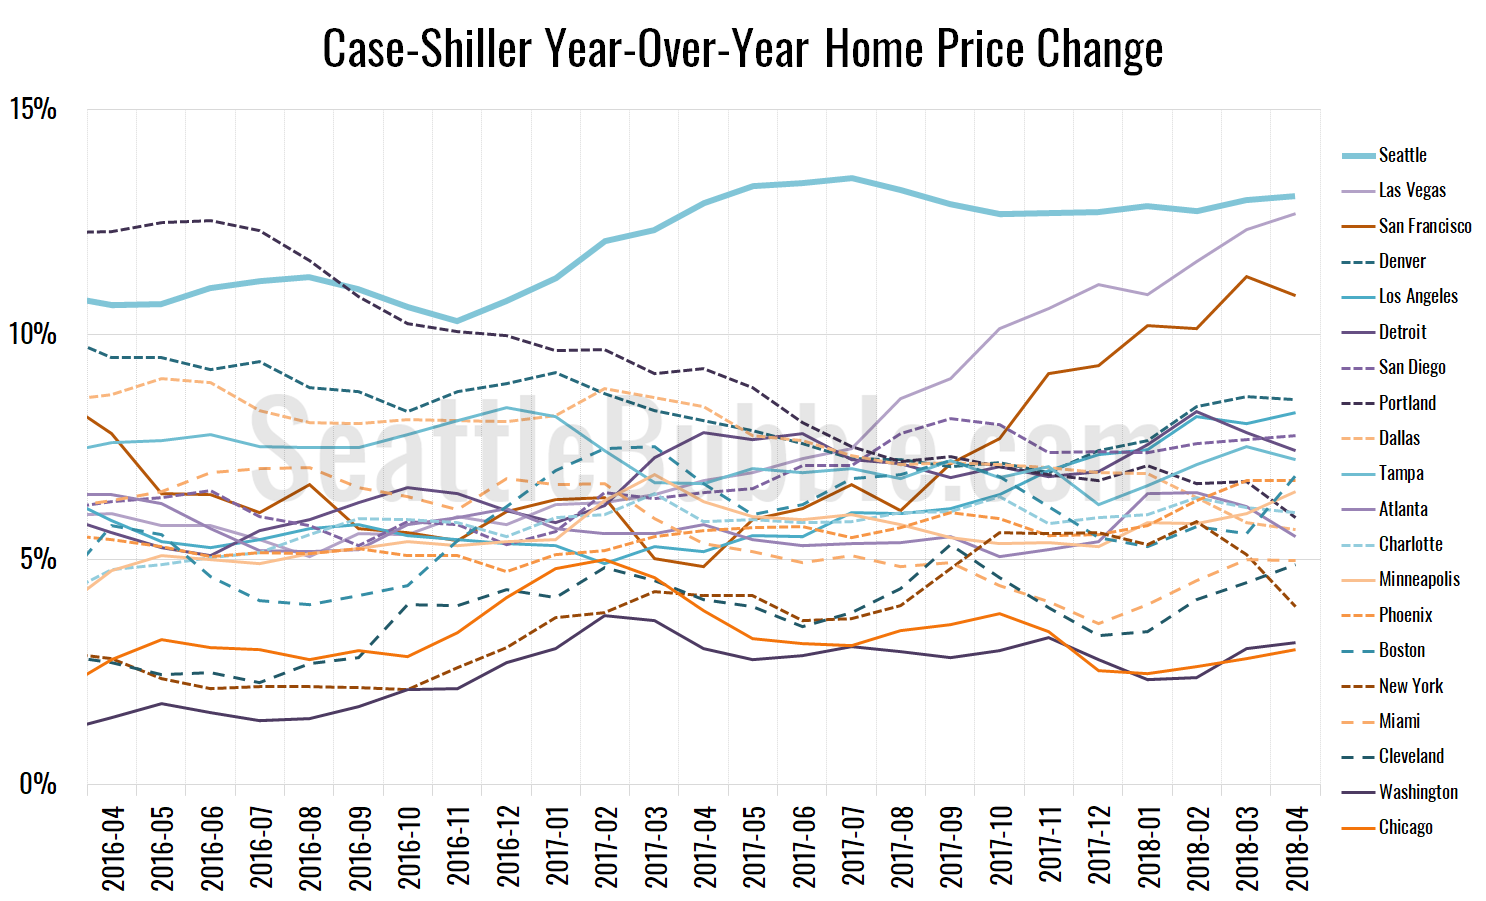
Up 12.1 percent YOY.
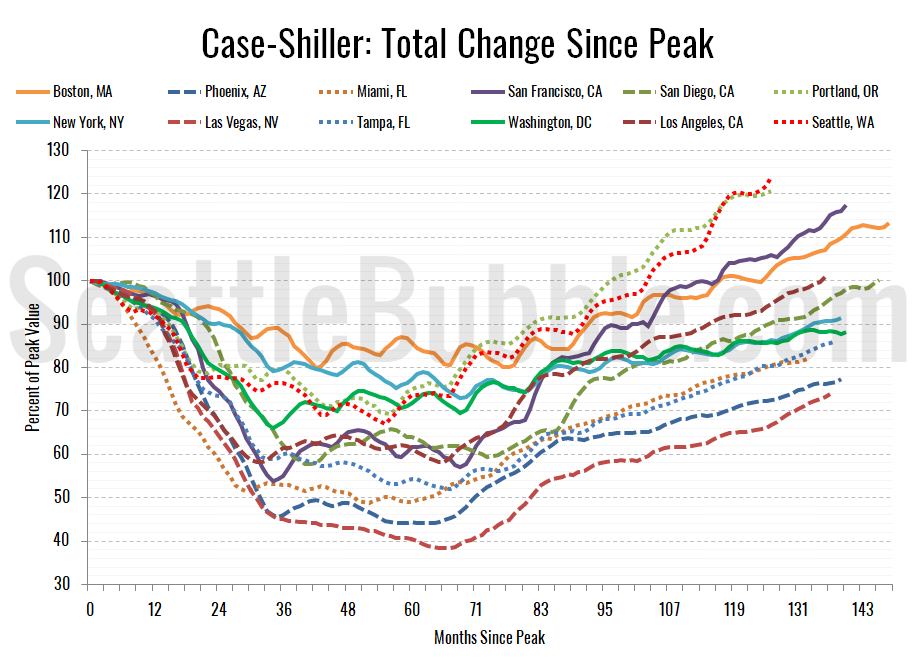
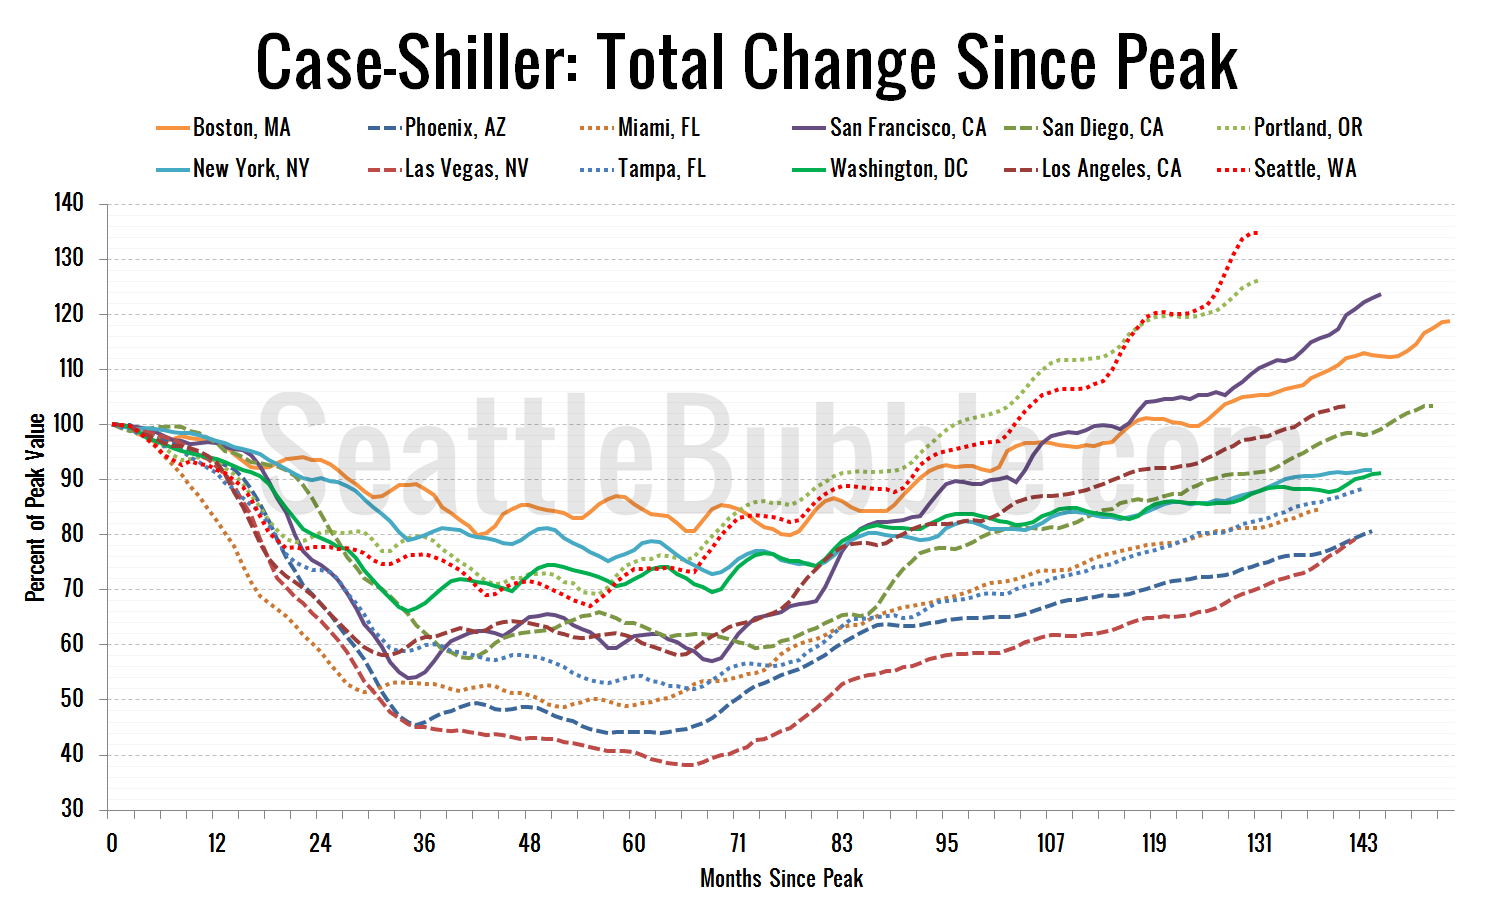
Up 34.7 percent from the July 2007 peak
Last year at this time prices were up 0.7 percent month-over-month and year-over-year prices were up 13.5 percent…