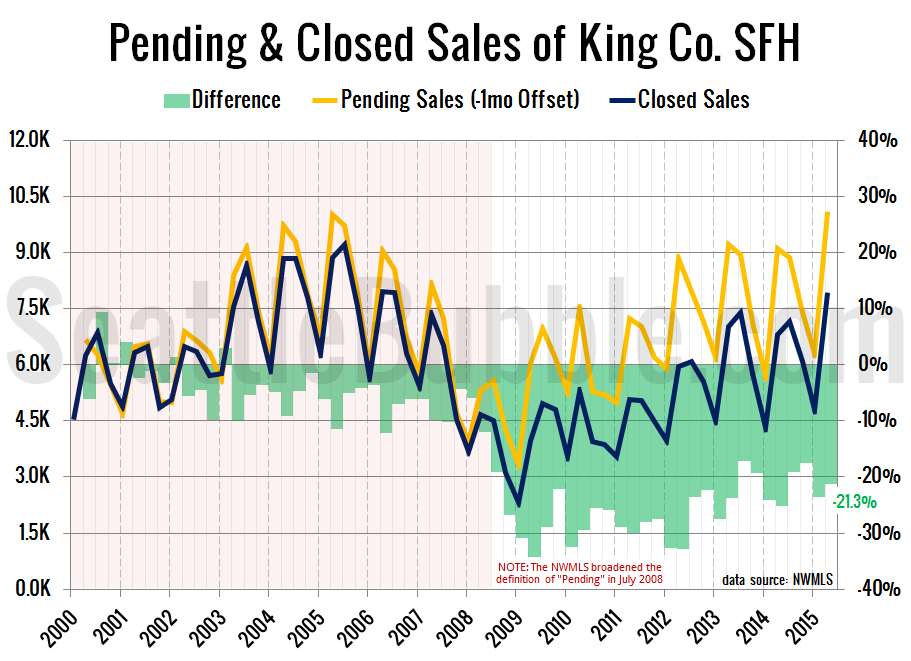
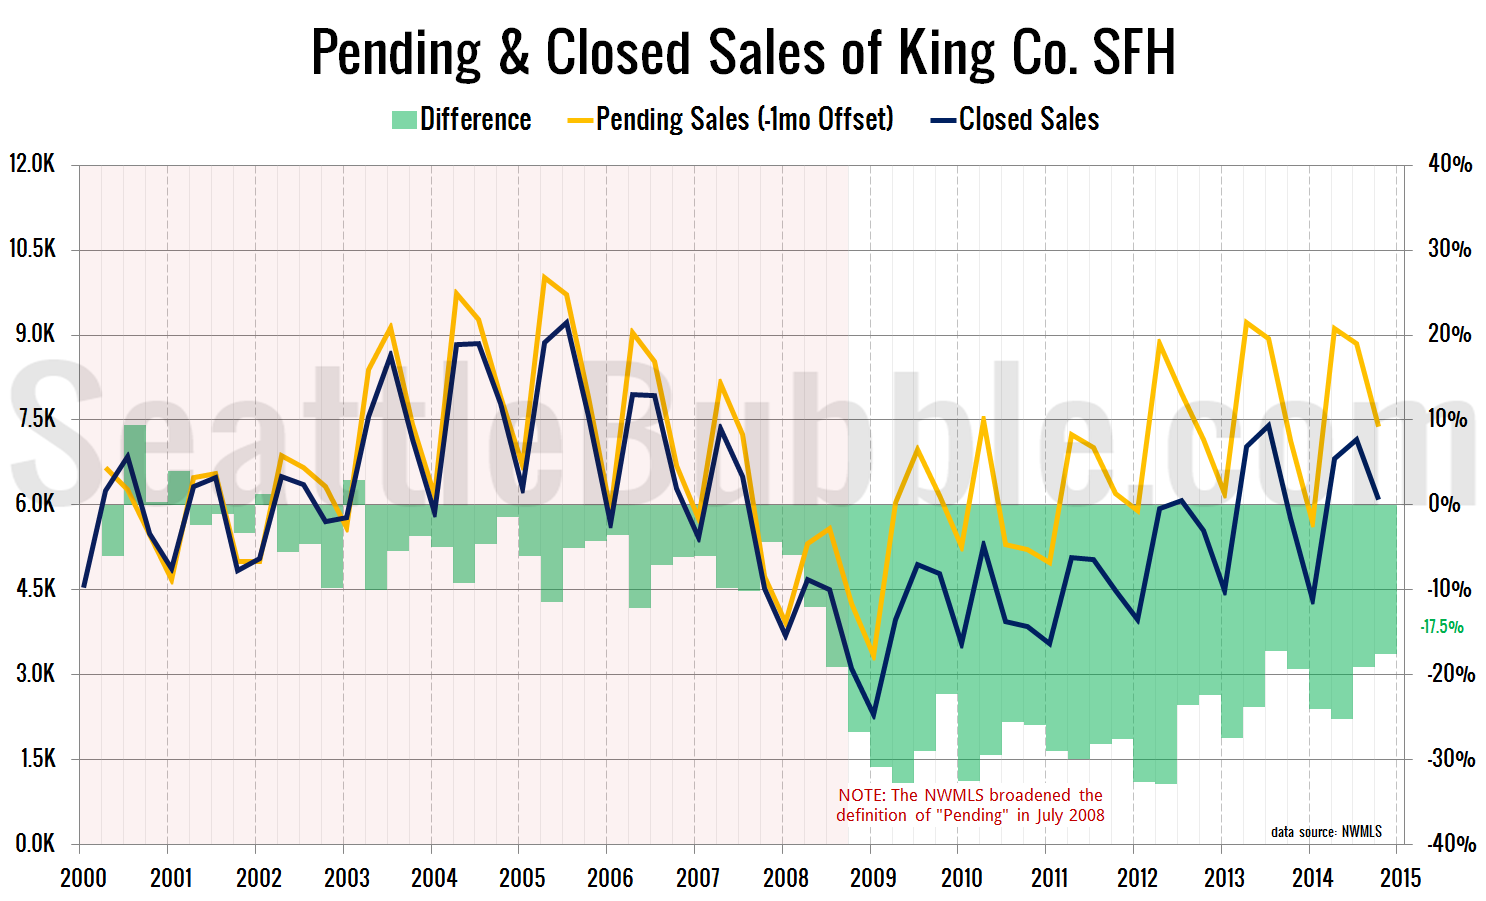
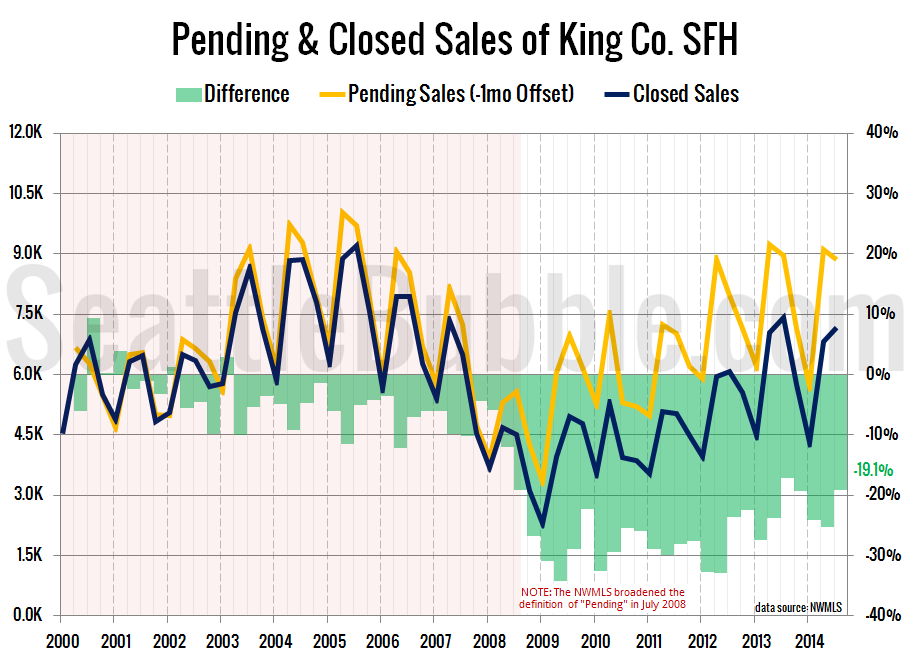
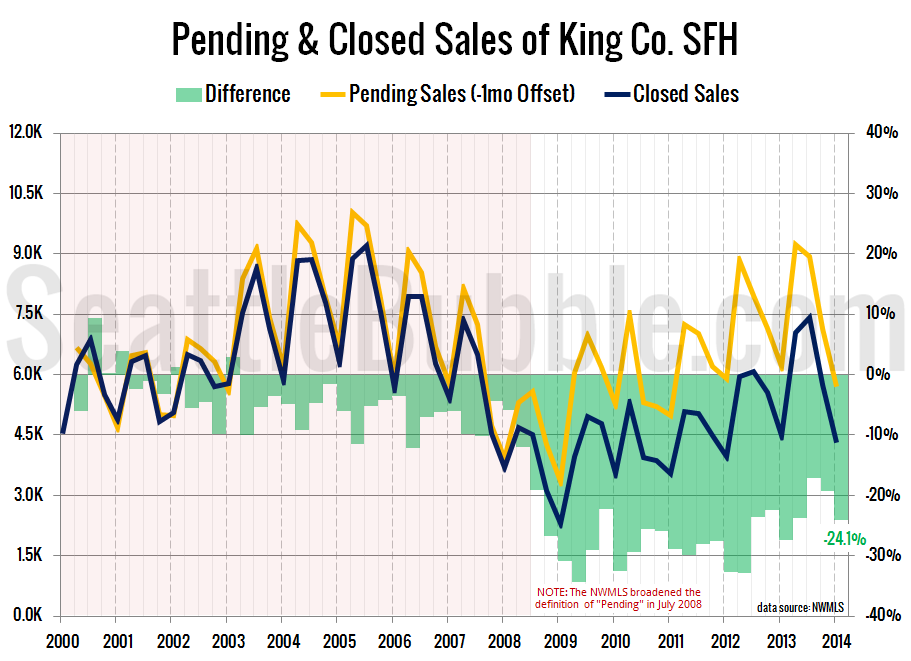
Seattle Bubble

News & discussion about real estate & the housing bubble in the Seattle area.

Seattle Bubble - News & discussion about real estate & the housing bubble in the Seattle area.

Entries Tagged as 'closed'

Estimating the Local Effects and Aftermath of the $8,000 Tax Credit

By The Tim on October 16th, 2009 at 6:00 AM · 60 Comments

Organizations like the National Ass. of Realtors and the National Ass. of Home Builders have been throwing around estimates of how many sales have been “stimulated” by the $8,000 tax credit nationwide, and a recent editorial by Washington State Treasurer James McIntire in favor of the inefficient, expensive, and economically stupid program throws out a number of 7,000 “stimulated” sales statewide.

How many sales locally have been “stimulated” by this ridiculous giveaway of tens of billions of dollars we don’t even have? Let’s try to see if we can estimate the number of stimulated single-family house sales for King County, using some trend analysis of closed sales data from 2000 through 2008.

2000-2009 King Co. SFH Closed SalesKing Co. SFH Closed Sales (2009 Hypothetical)

At left above is a chart that includes total closed sales each month from 2000 through 2009, with October and November data this year projected based on the May – September performance. At right above is a chart of a hypothetical “worst case” scenario of sales volume we may have seen without the influence of the $8,000 tax credit, generated by taking the average month-to-month change for each month in 2000-2008, and applying that from month to month in 2009, moving forward from the number of actual sales in April.

King Co. SFH Projected Sales: January - November 2009The “worst case” estimate at right above most likely understates the number of sales that would have taken place without the tax credit, since decreasing prices were already beginning to stimulate sales anyway, but for the sake of argument, let’s go with this estimate. Using the above estimates, we arrive at a total number of 3,850 tax credit “stimulated” sales of single-family houses in King County.

If we assume that 100% of the stimulated sales and 75% of the “worst case” baseline sales (i.e. – sales that would have happened anyway without the tax credit) were qualified first-time homebuyers, we can calculate that 11,911 sales will qualify this year for the tax credit. That’s a total cost to (future) U.S. taxpayers of over $95 million, for 3,850 “stimulated” SFH sales in King County—$25,000 per sale.

This is actually quite a bit lower than the nationwide estimates I have seen elsewhere, which put the cost per “stimulated” sale at around $43,000, which means we’re probably over-estimating the number of “stimulated” sales. With 60% as many “stimulated” sales (2,310), the cost per “stimulated” sale comes out to around $40,000.

If we assume that the lower number (2,310) is more reflective of reality and that roughly 90% of these sales were not pulled from thin air, but were in fact merely borrowed from 2010, we can calculate the approximate effect of the expiring tax credit on 2010 sales. Based on those assumptions, once the tax credit expires, we can expect sales to come in roughly 125 to 200 lower than they otherwise would have each month throughout 2010.

King Co. SFH Closed Sales (2010 Hypothetical)

Of course, that assumes that the tax credit will be allowed to expire, which is looking less and less likely. Not that extending it another six months to a year will somehow prevent the market from having to pay back the borrowed sales eventually (at a greater and greater cost the longer it is deferred), but why should pesky little economic realities prevent Congress from spending billions of additional dollars that we don’t have?

→ 60 CommentsCategories: Statistics
Tags: , , ,

Quick Look: August YTD Pending and Closed Sales

By The Tim on September 9th, 2009 at 12:21 PM · 16 Comments

Here’s an idea for a new occasional feature. In “quick look,” I’ll create a few charts, all depicting different takes on the same set of data. The charts will be presented with little to no commentary, to allow the graphs to speak for themselves.

This week’s theme is YTD pending and closed sales as of August.

King County Pending & Closed SFH Sales

August YTD % Change YOY - King Co. SFH Sales

Yearly Orphaned Pending Sales as of August

Let me know what you think of the “quick look” concept.

→ 16 CommentsCategories: Statistics
Tags: , , , , ,

Should the MLS Ban Short Sales?

By The Tim on September 2nd, 2009 at 6:00 AM · 96 Comments

In the comment thread on yesterday’s post there was some discussion about the ever-growing gap between pending sales and closed sales. Here’s a simple look at how they stack up through July (since August stats aren’t out just yet):

January - July 2009 Total King Co. SFH Sales

The massive difference between pending and closed sales brings up the question: Is there really a backlog of over 5,000 homes waiting to close?

Most likely no, there is no such tsunami of closings about to crash on the shores of the Puget Sound. This growing discrepancy is probably due to a couple of factors.

First, the redefinition of what is counted as a “pending sale” last year to include homes that have merely reached the inspection point naturally means that a larger number of these pendings will not close simply due to failed inspections.

However, the larger factor is probably short sales. Hundreds if not thousands of these pendings in limbo are probably due to a buyer making an offer on a short sale, the seller “accepting” the offer (at which point the “sale” is counted as pending) and sending it to the bank, and the bank simply never replying.

It is also worth mentioning that each of these 5,000+ seemingly dead pending sales represents two parties (the buyer and the seller) that have wasted their time submitting and reviewing offers. The situation is definitely not pretty. One of my coworkers recently purchased a short sale, and he went for months without hearing anything from the seller’s agent regarding the status of their offer. It took him threatening over the phone to drive his truck through the (vacant) house to finally spur some action by the seller’s agent and the bank (not a recommended course of action)!

One suggestion that was floated in yesterday’s conversation was that the NWMLS ban short sales in their system all together unless the seller has gotten a pre-approval from the bank on the list price. This would certainly save a lot of people a lot of headaches, and would probably overall help the market to be more efficient.

Have you had an experience with a short sale that completely died? What, if anything, do you think should be done about this growing problem?

→ 96 CommentsCategories: Statistics
Tags: , , ,

Another Look at Recent Pending and Closed Sales

By The Tim on August 11th, 2009 at 7:24 AM · 9 Comments

Here’s a belated look at the quarterly total sales chart, updated to include Q2:

King County Total SFH Closed Sales per Quarter

Still came in lower than any previous quarter—about 15% lower than last year. So far this quarter is off to a stronger start, with July sales coming in 11% higher than last year. It will be interesting to see if that holds for August and September.

Next, here’s another look at the monthly pending and closed sales chart, only this time I have split the pending sales onto separate vertical and horizontal axis to demonstrate the apparent two-month lag that has shown up in the data this year:

King County Pending and Closed Sales

It used to be (from 2000-2007) that a given month’s closed sales were (on average) about 95% of the previous month’s pending sales. So far this year the relationship has been closer to a given month’s closed sales coming in at 78% of the total pending sales from two months prior.

Here’s one more chart, with pending sales, closed sales, and a plot of pending sales * 78%, shifted two months into the future:

King County Pending and Closed Sales

If this relationship holds for August, it looks like we’ll see about 1,900 closed sales.

→ 9 CommentsCategories: Statistics
Tags: , , ,

Poll: Guess the maximum 1-month total closed SFH sales in King Co. for 2009

By The Tim on May 17th, 2009 at 12:05 AM · 36 Comments

For reference, 2008’s maximum was 1,592 in June. Here’s the monthly chart since 2000:

King County SFH Closed Sales

Please vote in this poll using the sidebar.

Guess the maximum 1-month total closed SFH sales in King Co. for 2009:

  • 1,250 or less (43%, 53 Votes)
  • 1,251 - 1500 (31%, 38 Votes)
  • 1501 - 1,750 (11%, 13 Votes)
  • 1,750 - 2000 (10%, 12 Votes)
  • 2000 - 2,250 (6%, 7 Votes)
  • 2,251 or more (-1%, 1 Votes)

Total Voters: 123


This poll will be active and displayed on the sidebar through 05.23.2009.

→ 36 CommentsCategories: Polls
Tags: , , ,

One in Three Q1 Pending Sales Failed to Close in 30 Days

By The Tim on May 7th, 2009 at 5:00 AM · 94 Comments

Now that 2009 Q1 + 1 month is in the past, let’s have an updated look at the relationship between pending and closed sales. For previous posts on this subject, hit the ‘pending’ tag archive.

Below is the updated chart including 2009 Q1. It shows quarterly King County SFH pending sales volume from the NWMLS, with closed sales offset by one month (since closings should theoretically take ~30 days). In other words, the pending sales data for Q1 includes January, February, and March, while the closed data is for February, March, and April. The blue and red lines represent pending and closed sales (left axis), while the green bars represent the percent difference between closed sales and pending sales (right axis).

Pending & Closed Sales - King Co. SFH

The 2000-2007 average difference between pending and closed sales for the first quarter was just 8.8%. In 2008, the difference per quarter was 7.5%, 15.9%, 20.7%, and 27.3%. In the first quarter 2009, the gap between the two widened for the fourth quarter in a row, to yet another new record of 35.9%.

Here’s a look at the month-to-month data for all sales (SFH and condos) in King, Snohomish, and Pierce back through the beginning of 2008:

Pending & Closed Sales - King / Snohomish / Pierce

There are two theories as to why this gap is becoming so large, both centered on short sales.

The first theory is that the “pending sales” statistic in the NWMLS end-of-month reports includes all sales that were in “pending” status as of the last day of the month, rather than counting all sales that changed from “active” to “pending” in the given month. This would cause short sales, which typically take longer than 30 days to close, to be counted as a “pending sale” for multiple months, thereby artificially inflating the pending sales data.

The second theory is that the number of short sales as a percentage of total sales is rapidly increasing every month, and therefore more and more closings each month are being delayed beyond the “normal” 30-day period.

In the chart below, I have attempted to visualize the second theory, based on the following:

  1. Fact: the average failure rate 2000-2007 was 5%
  2. Assumption: the excess apparent failed sales above 5% represent distressed sales
  3. Assumption: distressed sales will fail at quadruple the normal rate (20%)
  4. Assumption: distressed sales average 90 days to close

Here’s how King County’s SFH quarterly closed sales would break down over the last four quarters (with each quarter offset +1 month), given the above fact and assumptions:

Hypothetical King Co. SFH Closed Sales Breakdown

Interestingly, the 4-quarter total percentage of distressed sales calculated using the above assumptions comes out to 23%, which is fairly close to the number of foreclosure + short sale transactions reported by Zillow over the last year in the Seattle area. Their national spreadsheet says that 13.9% of the transactions in the Seattle-Tacoma-Bellevue area in the last 12 months were foreclosures, and 12.3% were short sales, for a total distressed sale percentage of 26.2%.

We still have not heard a definitive answer on the way that the NWMLS counts their end-of-month “pending sales” data, so we can’t rule out theory #1 entirely. But either way, the story here appears to be that a large number of short sales in the Seattle area are skewing the formerly-reliable pending sales statistic, making it increasingly difficult to get a true handle on what home-buying demand really looks like.

→ 94 CommentsCategories: Statistics
Tags: , , , , , , ,