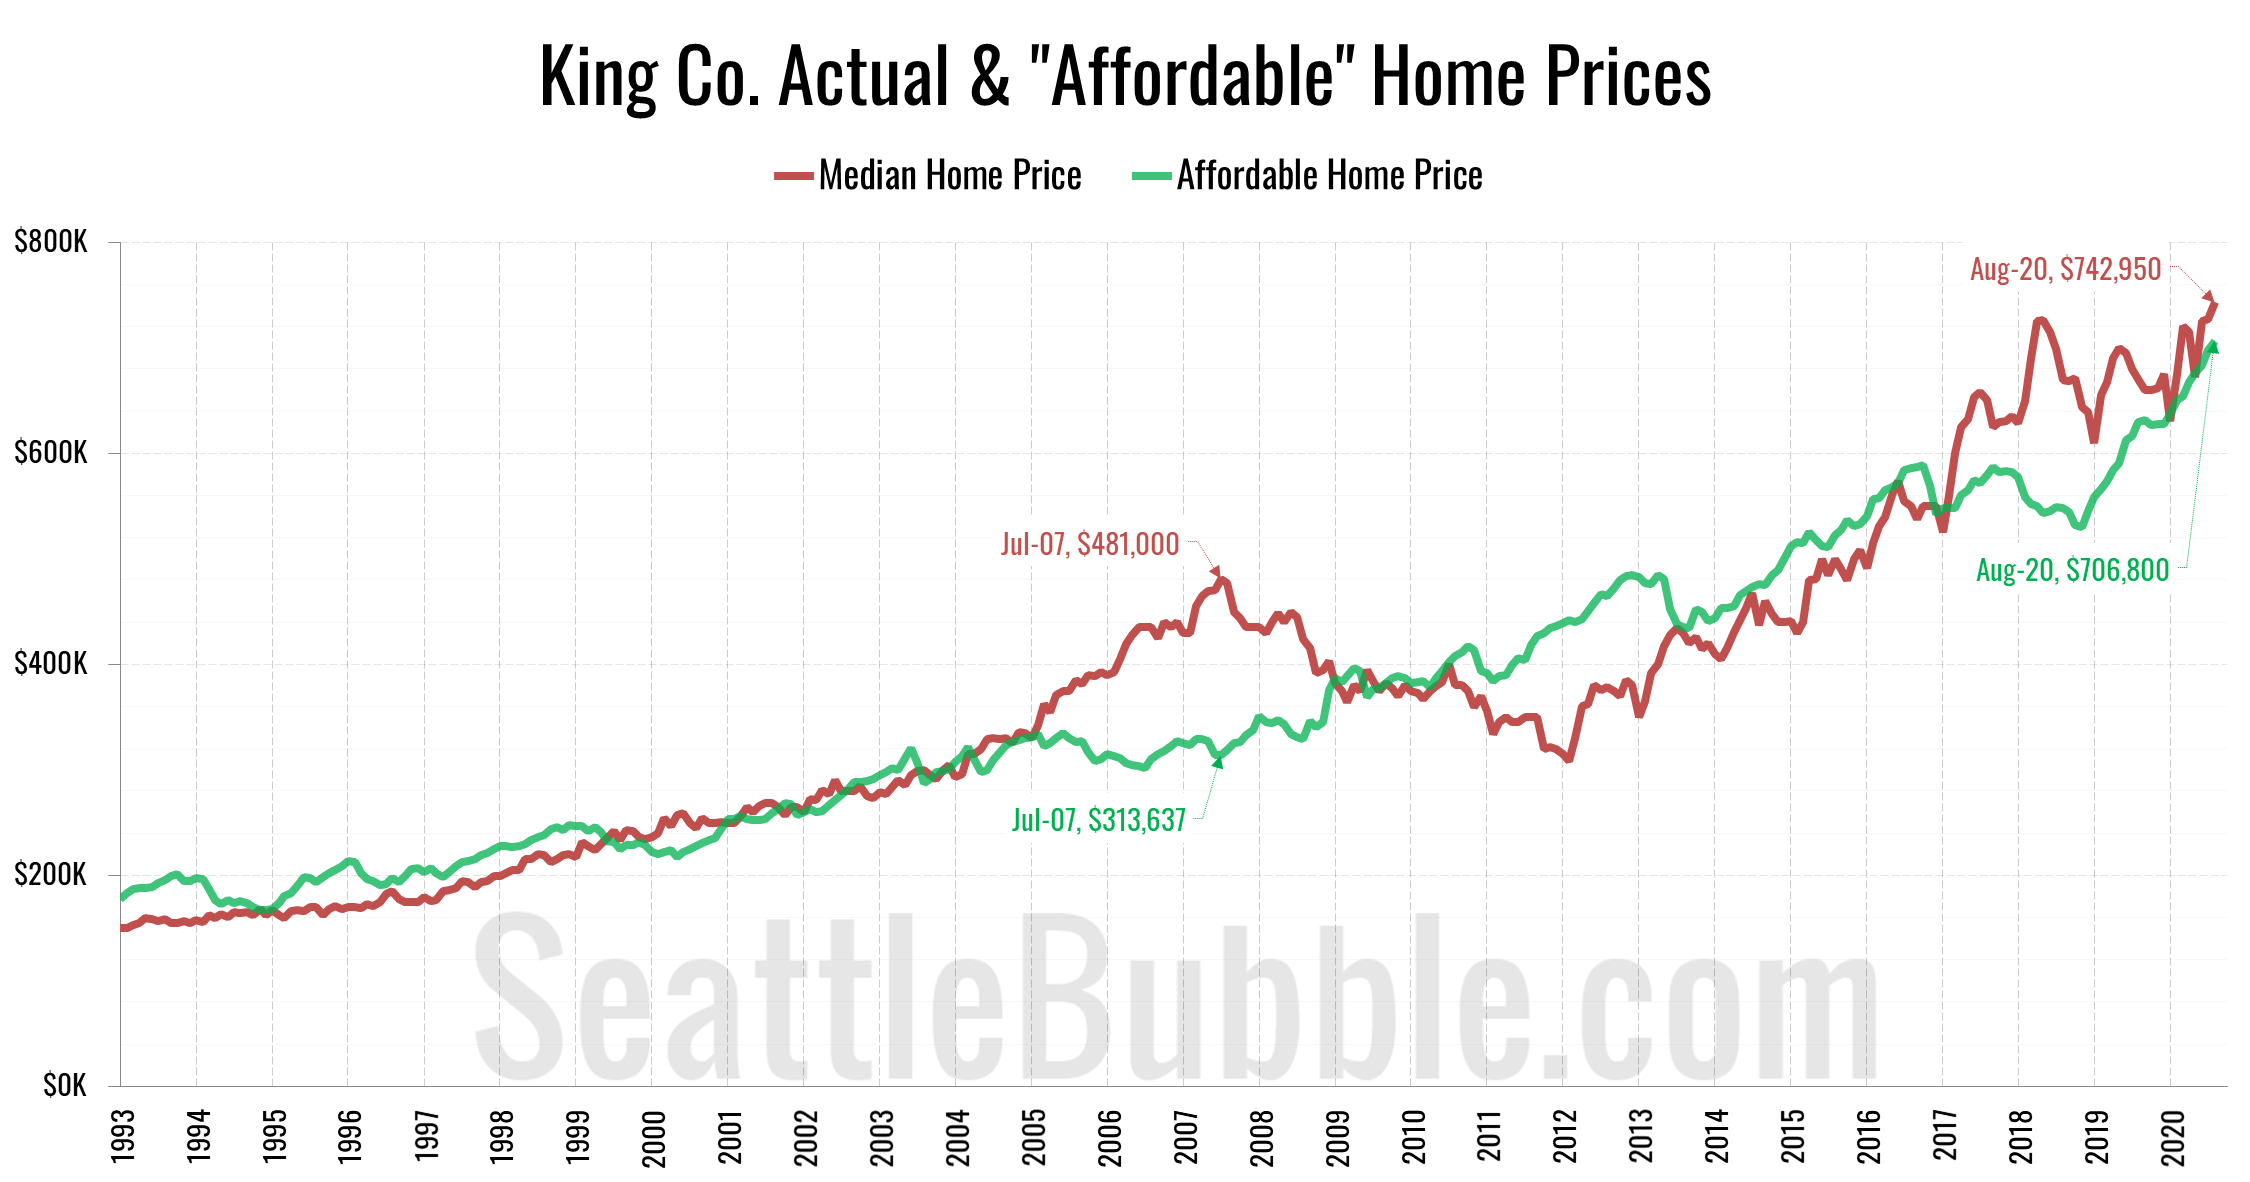
The “affordable” home price has shot up from $530,359 in November 2018 to an all-time high of $706,800 as of August. The current “affordable” home price in King County would have a monthly payment of $2,365…
local real estate news, statistics, and commentary without the sales spin.
The “affordable” home price has shot up from $530,359 in November 2018 to an all-time high of $706,800 as of August. The current “affordable” home price in King County would have a monthly payment of $2,365…
It’s been quite a while since we’ve had a look at our affordability index charts for the counties around Puget Sound, so let’s have a look at those charts…
As promised yesterday, here’s an updated look at the “affordable home” price chart.
…
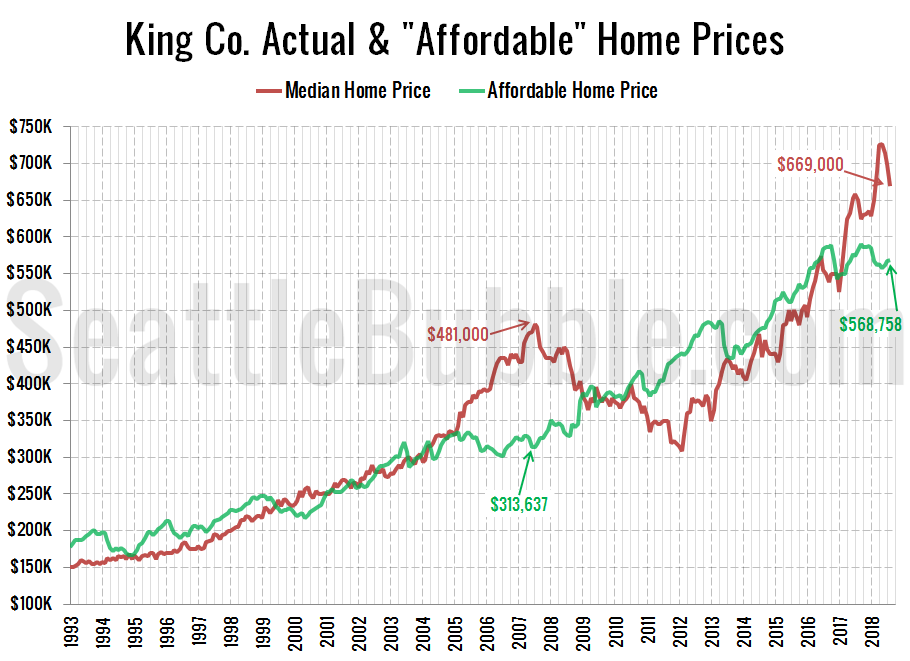
The “affordable” home price has bounced around between about $550,000 and $590,000 since the beginning of 2017. The current “affordable” home price of $568,758 in King County would have a monthly payment of $2,319…
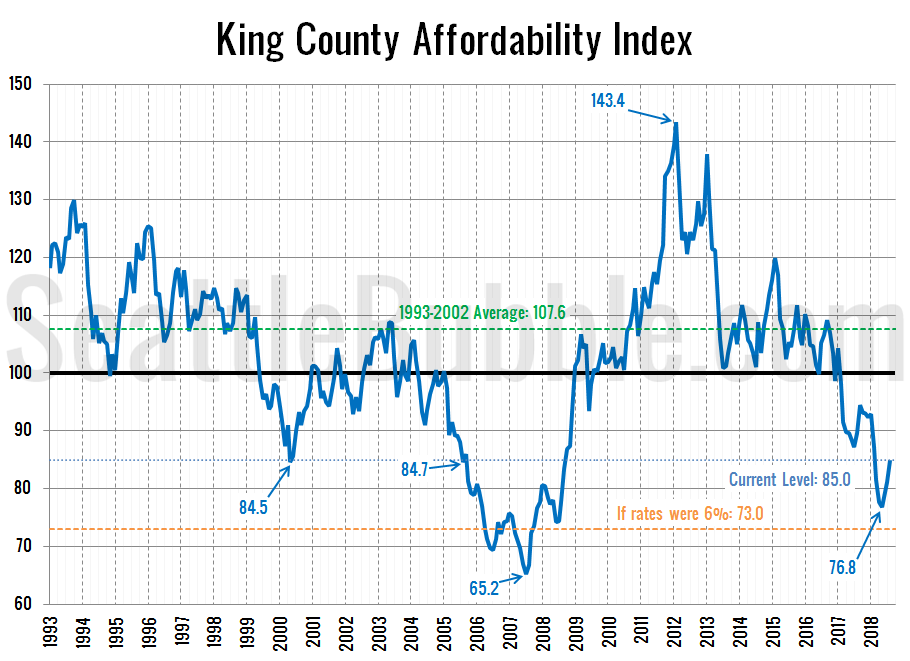
By popular request, let’s take a look at our affordability index charts for the counties around Puget Sound.
As of August, the affordability index has bounced up slightly from its May low (which was the lowest point since nearly a decade ago in July 2008), but still sits at the very low level of 85.0.
For context, eighty-six percent of the 306 months on record back through 1993 have had a higher affordability index than what we had in August 2018…
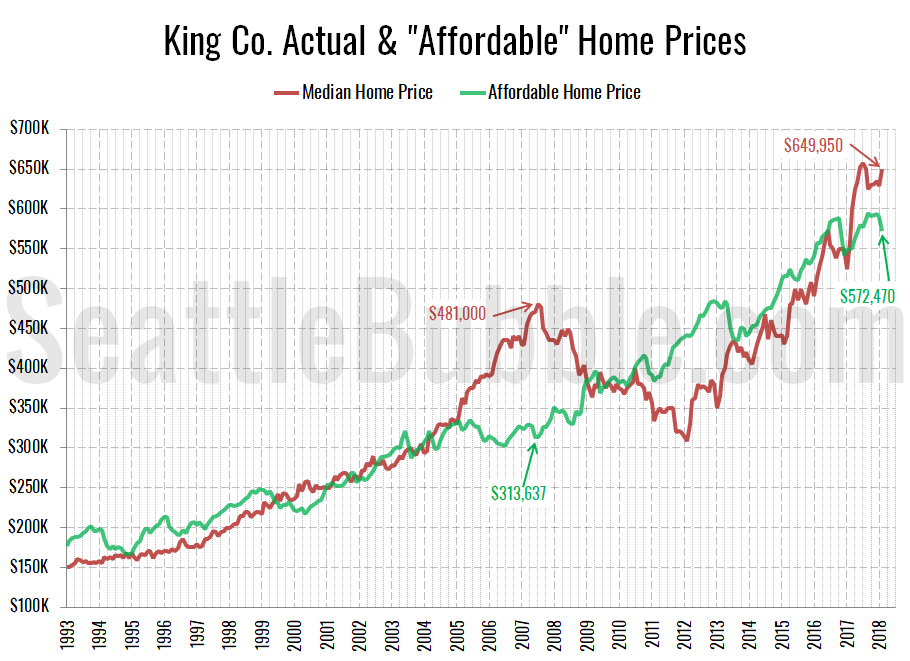
As promised in Monday’s affordability post, here’s an updated look at the “affordable home” price chart.
In this graph I flip the variables in the affordability index calculation around to other sides of the equation to calculate what price home the a family earning the median household income could “afford” to buy at today’s mortgage rates, if they spent 30% of their monthly gross income on their home payment. Don’t forget that this math includes the (giant) assumption that the home buyers putting 20% down, which would be $129,990 at today’s median price.