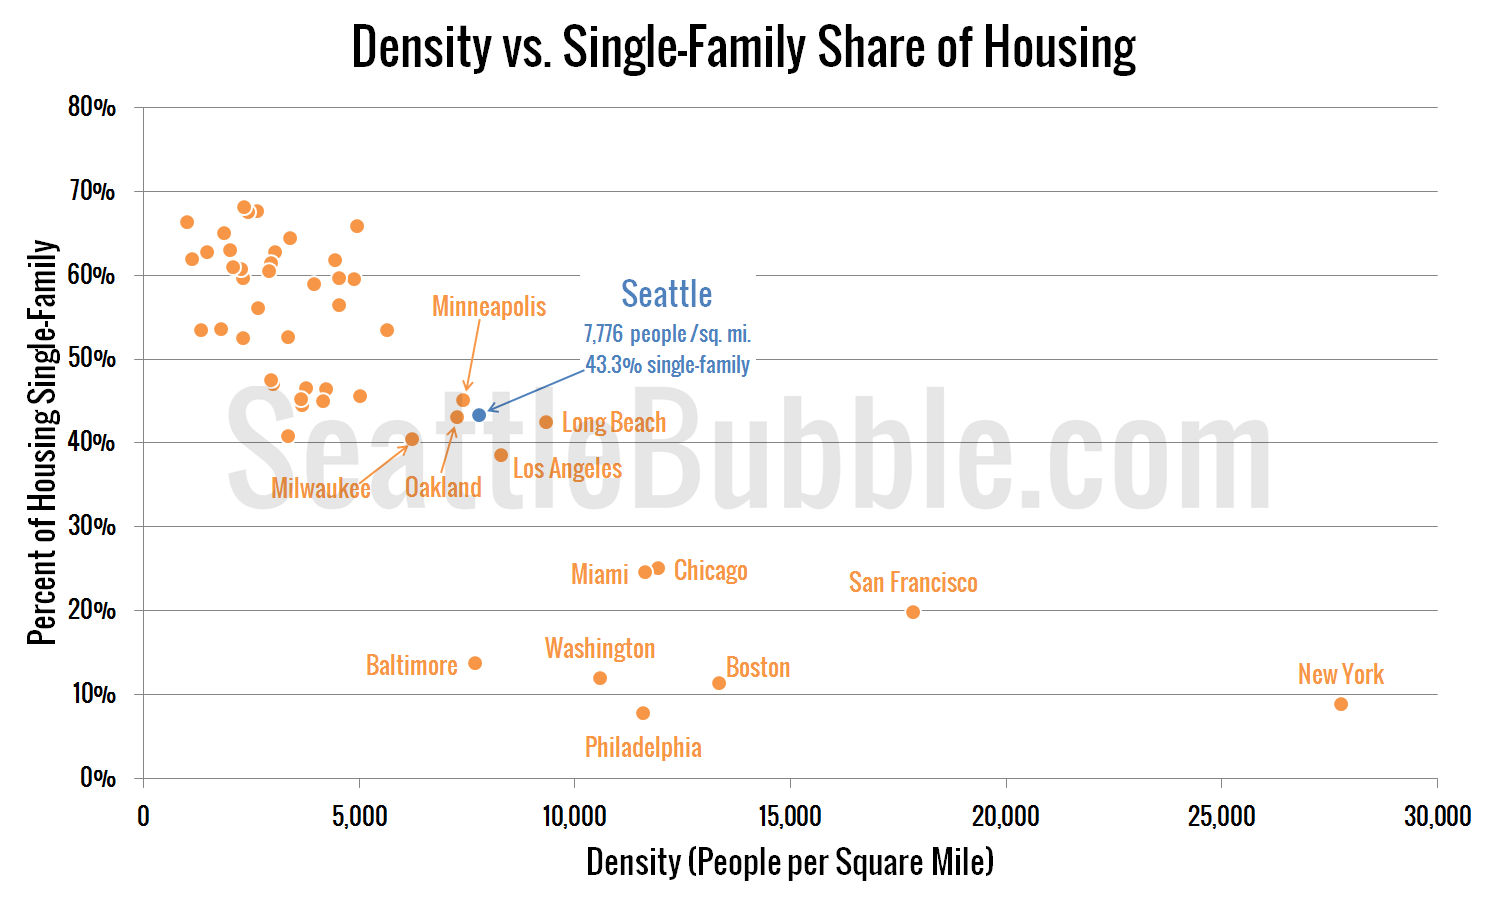
By The Tim on October 22nd, 2009 at 6:00 AM · 20 Comments
Here’s a quarterly check on the jobs situation around Seattle, courtesy of data from the Washington State Employment Security Department. The style of these charts are stolen from the excellent San Diego housing reporter Rich Toscano.
First up, here’s a two-year chart (stolen from my subscription journal Sound Housing Quarterly) of the year-over-year change in some of the broad job categories related to housing:

As of September, construction was still bleeding jobs at a rate of nearly 20% per year, though the rate of change has at least leveled off since March. Finance and real estate jobs have shown a similar pattern, leveling off at around 7-8% year-over-year drops. No particular signs of improvement in the year-over-year numbers just yet though.
The following chart shows the volume of job gains or losses in the last 12 months in some of the largest Seattle-area industries:

The same three sectors that were hurting in our June update are still suffering as of September: manufacturing, construction, and professional / business services. Between the three, a total of 50,600 jobs have been lost in the last year. Health care was the only major sector that added jobs in the period.
Here’s a look at the same data, broken down by the year-over-year percentage change, to give a better picture of the relative health of various industries:

Construction sticks out like a sore thumb in this view, with finance / real estate joining the general range of losses seen in manufacturing and professional / business services.
Lastly, here’s a big pie chart showing all major industries that make up Seattle’s job market, to give you some additional perspective to the above data:

Source: Washington State Employment Security Department
Categories: Statistics
Tags: Jobs, job_growth, unemployment
Rich Toscano posted a great breakdown of the job situation down in San Diego yesterday that I thought was an interesting way to look at the data, so I’m shamelessly and blatantly copying it.
The following chart shows the volume of job gains or losses in the last 12 months in some of the largest Seattle-area industries:

Manufacturing, construction, and professional / business services were by far the hardest hit in sheer volume, losing a total of 42,700 jobs between the three sectors.
Here’s a look at the same data, broken down by the year-over-year percentage change, to give a better picture of the relative health of various industries:

Relative to its size, construction has shed twice as many jobs as any other sector, while finance / real estate, manufacturing, and professional / business services all also lost over 5%. Apparently if you’re looking for a job in health services, you have a much better chance than most any other industry in the last year.
Finally, here’s a big pie chart showing all major industries that make up Seattle’s job market, to give you an idea which sectors have the largest effect on the total employment picture:

Source: Washington State Employment Security Department
Categories: Statistics
Tags: Jobs, job_growth, unemployment
Latest state unemployment figures came out yesterday. Here’s a brief look.
Seattle area’s (King/Snohomish) unemployment rate (not seasonally adjusted):

And here’s a graph that I created for Sound Housing Quarterly, which shows the percentage change year-over-year in various job categories, also for King/Snohomish:

If you take out construction, finance/real estate, and retail, the number of jobs in the Seattle area only dropped by 0.75% from June ‘08 to June ‘09. Including those sectors, it fell 3.97%.
Note that the flattening in the line for construction in above chart does not indicate that the job losses have subsided, merely that the rate of job losses is no longer accelerating. As of June, the number of construction jobs in the Seattle area had fallen around 15% year-over-year for three months in a row.
Source: Washington State Employment Security Department
Categories: News
Tags: job_growth, unemployment
By The Tim on July 12th, 2009 at 12:05 AM · 20 Comments
Please vote in this poll using the sidebar.
Will Boeing (mostly) leave the Puget Sound region by 2030?
- Definitely not. (3%, 4 Votes)
- Probably not. (24%, 37 Votes)
- Maybe? (14%, 22 Votes)
- Probably. (40%, 61 Votes)
- Definitely. (19%, 30 Votes)
Total Voters: 154
This poll will be active and displayed on the sidebar through 07.18.2009.
Categories: Polls
Tags: Boeing, job_growth, Polls
By The Tim on June 16th, 2009 at 12:35 PM · 23 Comments
Just a quick update on the unemployment rate. According to data from the Washington State Employment Security Department, both statewide and King County unemployment have resumed their rise, pushing close to double-digits:

After dropping from 7.9% to 7.0% from March to April, King County’s unemployment rate shot up a full point to (barely) reach a new high of 8.0% in May.
Here’s a look at King, Pierce, and Snohomish:

Pierce has been above 10% for three months running now.
Categories: News
Tags: job_growth, unemployment
Here are a few relevant news stories that have popped into my inbox in the last few days:
In the last article, Aubrey Cohen picks up on the pending story we explored on here a couple weeks ago. The NWMLS representative he spoke with provided the same two explanations for the pending/closed discrepancy that we independently deducted here: short sales and the NWMLS definition change.
From Aubrey’s article:
Bob Gent, director of business development and member relations for the listing service, acknowledged the definition change had an impact. In fact, he provided statistics showing that the rate of pending listings going back on the market jumped from 1.5 percent in January through May of 2008 to 4 percent in June 2008 through April 2009.
But said the change could only account for part of the recent increase in pending sales. Take out all the pending sales that went back on the market last April and this April, and there’s still a 6-percent increase.
”Did it have an impact? Yes,” Gent said. “It’s not big enough to explain the situation.”
So why are the increased pending sales not yet showing up in closed deals?
“The length of time from going pending to close has increased dramatically in the past few months due to short sales,” Gent said.
You may notice of course that Mr. Gent avoids addressing the issue of how many of these “pending” short sales simply never close. Local agent and Seattle Bubble regular Kary L. Krismer points out some common reasons why short sales are often failing to close in the P-I comments:
There are a number of reasons a short sale could fall out, including:
- Buyer gets tired of waiting.
- Bank refuses to accept unrealistically low price, and buyer refuses to pay more.
- Seller figures out that the bank isn’t going to release the balance, and that they’re better off being foreclosed.
Again, I’m not contending that sales are not increasing. In fact I have predicted that they will increase as prices continue to fall, just as they have in other parts of the country further along the bust cycle than Seattle. I just think the combination of short sales (which fail more often than normal sales) and the NWMLS “pending” definition change are overstating the increase.
Categories: News
Tags: AP, Boeing, condos, Everett, Everett_Herald, Jobs, job_growth, link_roundup, pending, Seattle Times, Seattle_PI, small spaces, Tacoma_Tribune, unemployment