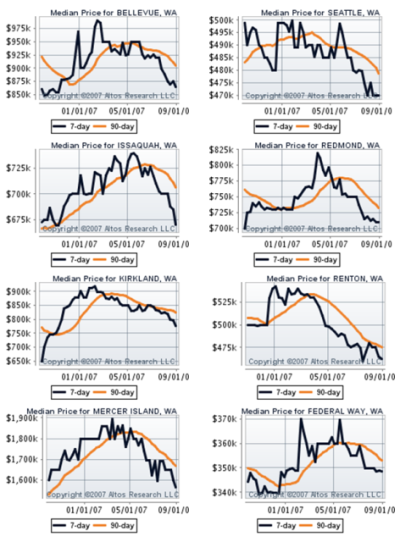
I’ve been gone a couple weeks on vacation, out of the country – where I was blissfully disconnected from the internet and all news of the US economy. In the course of catching up on goings on, I surfed over to Altos Research to see what they were reporting. I clicked through a number of the key population centers in King County and found the following:
Anyone notice a trend here? Now, these charts are based on median asking prices for properties that have been pulled off of publicly available sources of listings (e.g. REALTOR.com, Windermere). They do not represent homes closing. However, there does seem to be pretty similar trend across these cities. Asking prices have dropped fairly consistently since the late-April/early-May. As a matter of fact, through a set of random clicks – I only noted two communities (Sammamish and Medina) that seemed to be bucking the trend. I don’t claim this is scientific analysis – but it’s pretty interesting nonetheless. My buddy who runs Altos told me once that changes in asking prices were over 95% percent correlated with changes in closing prices. So if you think about homes taking 60-90 days to close, then shouldn’t we start seeing the same trend in closing prices in August and September? (and when do we get those August numbers, anyway?)
Addendum from The Tim
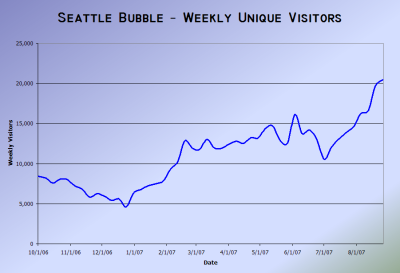
Speaking of trends, here’s a plot of the weekly “unique visitors” at Seattle Bubble over the same timeframe as the graphs above:
We were getting an average of 1,159 visitors per day back in October of last year, then 1,711 in March, and we reached 2,565 last month. Looks like the word is getting out…

