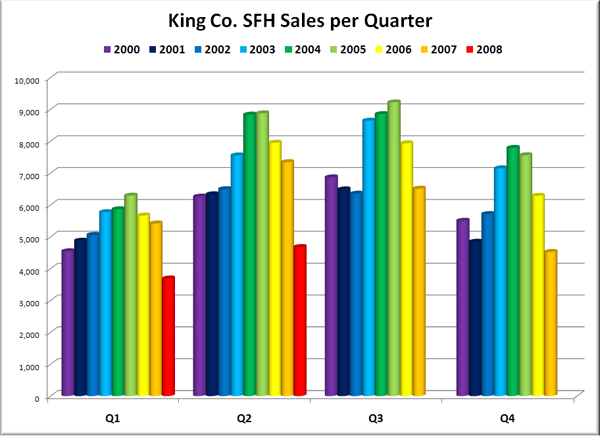
A reader suggested that a good way to visualize the current state of the local housing market would be to look at quarterly home sales. Here’s a chart of the total closed SFH sales in King County for every quarter we have data for from the NWMLS, back through 2000:
Note that the second quarter of 2008 was the fourth-lowest quarter on record, beaten only by 2000:Q1, 2007:Q4, and 2008:Q1. It is by far the worst of the spring and summer quarters, coming in over 25% lower than the previous slowest spring or summer quarter, 2000:Q2.
Also worth noting is the fact that the Q1 to Q2 increase in sales in 2008 was the smallest on record. Q1 to Q2 increases in 2000-2007 ranged from 28% to 51%, and averaged 37%. The increase in 2008 was 26.8%.
Was the first quarter of 2008 the bottom of the local housing downturn? Doesn’t look like it. Will the second quarter be the bottom? I doubt it, but time will tell.
