With Q3 + 1 month now behind us, it’s time to take another look at the relationship between pending and closed sales. Recall that in Q2, a record-setting 15.9% of pending sales had fallen through and never showed up as closed sales.
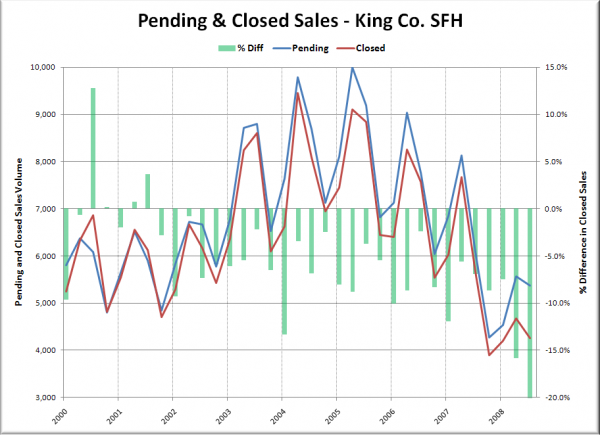
Here’s an update. The graph below shows quarterly King County SFH pending sales volume from the NWMLS, with closed sales offset by one month (since most closings theoretically take ~30 days). In other words, the pending sales data for Q3 includes July, August, and September, while the closed data is for August, September, and October. The blue and red lines represent pending and closed sales (left axis), while the green bars represent the percent difference between closed sales and pending sales (right axis).
The 2000-2007 average difference between pending and closed sales for the third quarter was just 1.6% (3.7% if you disregard the strange data in 2000 when closed sales exceeded pendings somehow in Q3). In the third quarter 2008, the gap between the two widened to just over 20%.
This is a huge difference, and something I’m amazed the local media is not reporting on. It also makes the monthly report on year-over-year pending sales stats increasingly more useless as a measure of market health. So pending sales were up 15% year-over-year in September. Does that really mean much if 20% of those sales never actually close (vs. just 7% the year before)?
The long-term average for 2000-2007 was that only 5% of pending sales failed to show up as closed sales. We are now at four times that rate. This is not something we should be ignoring when attempting to determine the health of the local market.
