Is it time for January market statistics from the NWMLS already? Yes it is.
Here’s the NWMLS press release.
“The market seems to be gaining momentum, and buyers seem to be feeling more confident,” reports Northwest MLS director Meribeth Hutchings. Agents are more optimistic and banks are getting more realistic on pricing bank-owned homes and bank-controlled homes (short sales), which is helping move that inventory, she stated. “The sooner we can eliminate that inventory, the sooner we will get back to a healthy market,” says Hutchings, the broker/owner of Windermere Real Estate/Lake Stevens, Inc.
…
“Home buyers in Pierce and Kitsap are starting to recognize the opportunities that exist for first-time buyers and those looking to buy a home in the more affordable price ranges,” said J. Lennox Scott, chairman and CEO of John L. Scott Real Estate. “These areas were the first to feel the housing market adjustment, so it’s natural that they would lead the road to recovery,” he added.
…
“It’s pretty clear that the real estate train came to a complete stop over the past few months,” acknowledges NWMLS Pat Grimm, owner/broker of Windermere Real Estate/Capitol Hill, Inc. “The good news is that the train was moving pretty fast before and now people have an opportunity to get aboard.” Affordability is the key, according to Grimm. “With interest rates and prices down, dream properties are within reach again and we’re starting to feel the train building up steam.”
Choo-choo!
Here’s your King County SFH summary:
January 2009
Active Listings: down 2% YOY
Pending Sales: down 5% YOY
Closed Sales: down 35% YOY
Months of Supply: 7.8
Median Closed Price*: $382,500 – down 12.1% YOY
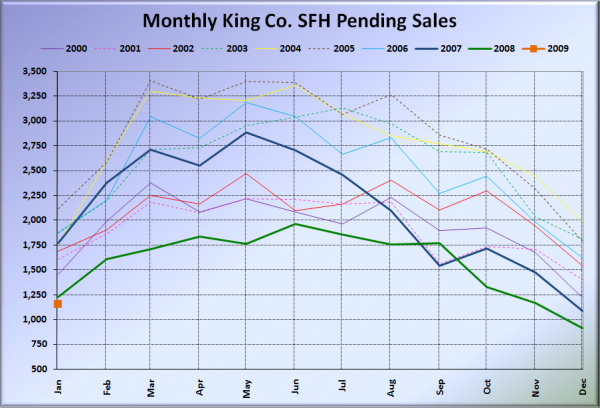
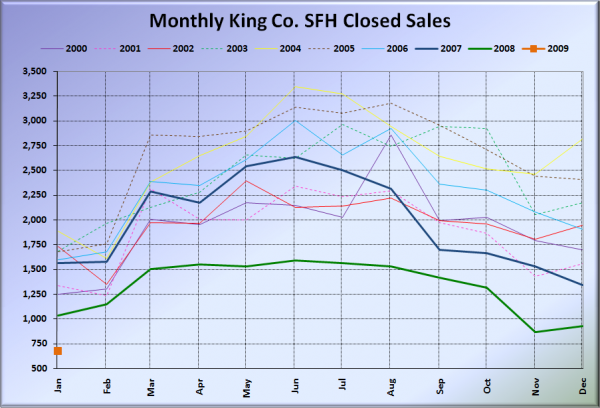
Pending sales bumped up slightly from December to January (as they do every year), while closed sales took an absolute nose-dive, dropping to another all-time low of just 674 sales in January. Ouch. Meanwhile, listings posted their first year-over-year decline since March 2006.
Here is the updated Seattle Bubble Spreadsheet, and here’s a copy in Excel 2003 format. Click below for the graphs and the rest of the post.
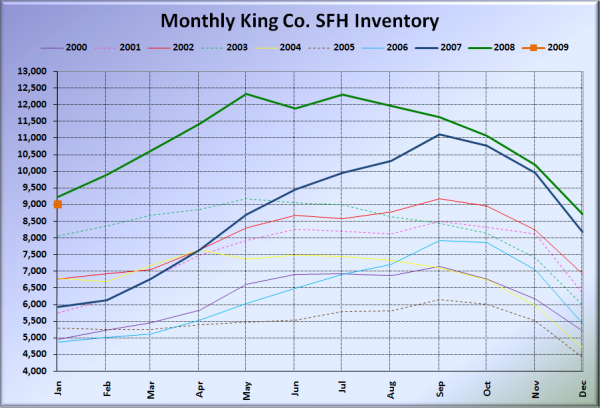
Here’s the graph of inventory with each year overlaid on the same chart.
Looks like we’re starting off 2009 slightly lower than 2008. It will be interesting to see where things go from here.
Pending sales recovered slightly, but still came in at a record low for the month of January. The same chart for closed sales is even more dramatic:
Yowza.
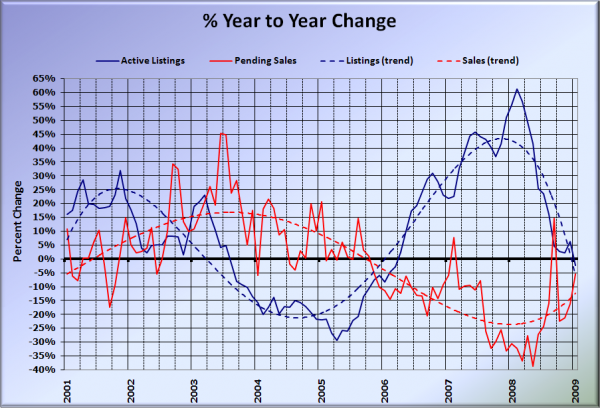
Here’s the supply/demand YOY graph.
Sales still negative, with listings turning just barely negative as well.
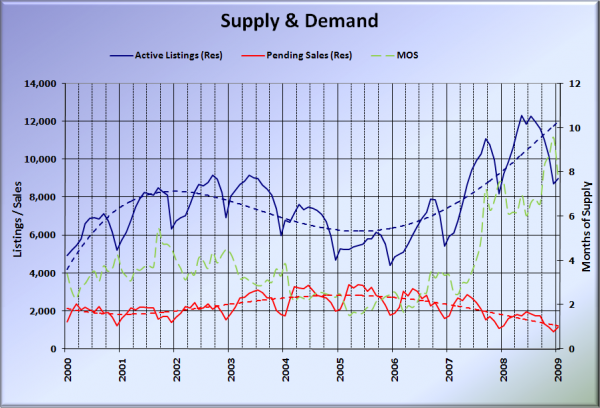
Here’s the chart of supply and demand raw numbers:
Months of Supply dropped from its December high, but remains above the 6.0 level, indicating a so-called “buyer’s market” for the 17th month in a row in King County SFH.
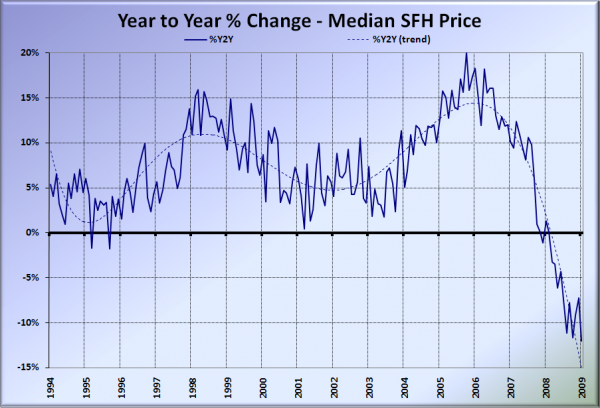
Here’s the median home price YOY change graph:
January marked another new low for YOY median SFH price changes at just over a 12% drop.
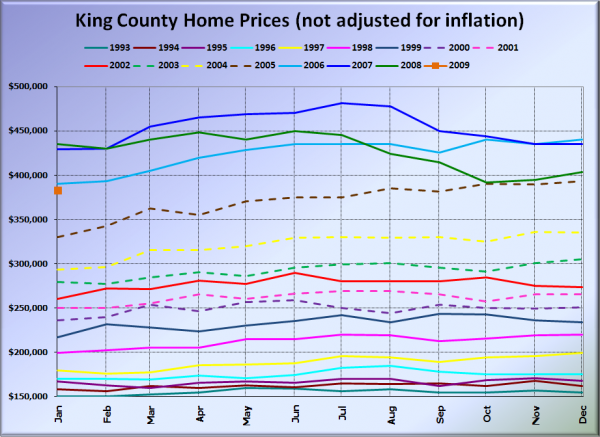
And lastly, here is the chart comparing King County SFH prices each month for every year back to 1994.
January 2009 King County median SFH price: $382,500.
August 2005 King County median SFH price: $385,000.
Hmm, why does August 2005 ring a bell to me…
Here are the news blurbs from the Times and P-I. Check back tomorrow for the full reporting roundup.
Seattle Times: Home prices decline for 12th straight month
Seattle P-I: King County house price hits lowest in three years
