Seattle Times business reporter Eric Pryne quoted me yesterday in his article about the affordability index, and as I was reading through the comments posted at the Seattle Times website, I noticed an awful lot of misconceptions about what the affordability index is, and what it tells us. So, I thought maybe it would be a good time for a bit of an in-depth course on the concepts behind the affordability index.
Any time you attempt to simplify a complex concept into a single number, it is important to recognize the assumptions that go into calculating that number. Whether we are discussing the affordability index, the Case-Shiller home price index, or even the UV index, full understanding is crucial to a constructive conversation.
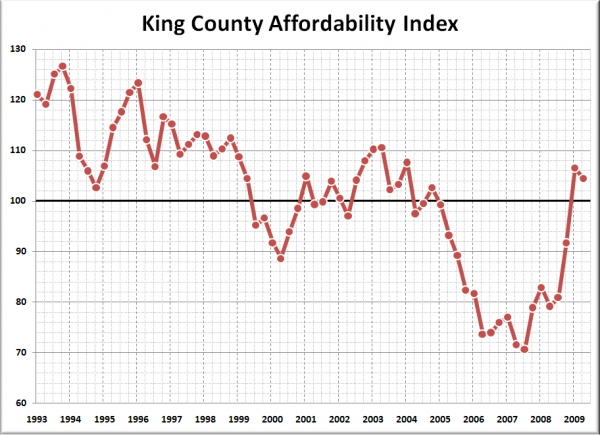
To kick things off, here’s King County’s quarterly affordability index back through 1993, the furthest back NWMLS median home price data is available, so we can all get a visual of the data that we’re discussing.
What the Affordability Index Is
In short, the affordability index is a simple measure that shows the relationship between median home prices, median household incomes, and interest rates. It is useful merely as one tool of many in gauging the overall health of a given housing market.
It is calculated by determining the monthly payment (principal and interest) that would result from buying the median-priced home, assuming a 20% down payment and current interest rates on a 30-year fixed-rate mortgage, then comparing that to 30%* of the monthly median household income (the standard measure of “affordable housing”). Note that the median household income is merely the mid-point taken from a sample of all households in the county, whether they are one person households or ten person households.
An affordability index of 100 means that a hypothetical household earning the median household income would pay exactly 30% of their monthly income toward the principal and interest of a mortgage on the median-priced house if they bought today with 20% down using a 30-year mortgage at prevailing interest rates. Above 100 is more affordable, while below 100 is less affordable.
What the Affordability Index Is Not
The affordability index is not intended to tell you whether or not you can afford a specific house in your specific financial situation. It is not a tool for determining the value of a specific house. It should not be used as a sole signal of when it is or is not a “good time to buy.”
Interest rates are used in calculating the affordability index, but the availability of financing is not a factor in the calculation. There is no easy way to quantify the fact that in 2005 anyone who could “fog a mirror” could waltz into a $400,000 loan, while today the standards are much stricter.
The historic standard for “affordable housing” is that a household not spend more than 30% of their gross income on total housing expenses. Note that when we calculate the affordability index we are only taking into account the principal and interest payment on the mortgage. The affordability index does not include the expense of taxes, insurance, maintenance, or any sort of home owners’ association dues.
It is also important to note that with respect to down payments, the affordability index simply assumes 20% down, and leaves it at that. Obviously very few people have 20% of the median home price saved up in cash sitting in a bank account to be used as a down payment. With the median single-family home priced at $384,000 in King County as of July, that would be $76,800. I would not be surprised if the majority of families do not even have one tenth that amount saved. However, you have to assume something, and if you assume less than 20% the equation would become much more complicated with PMI or piggy-back loans.
The affordability index also does not take into account an area’s jobless rate. An affordability index of 100 does not mean that a majority of households can now afford to buy a house, because it does not factor in unemployment, savings, or credit scores.
Conclusion
Some of the commenters on the Seattle Times article seemed to be extremely frustrated, decrying the article as “lies and inflated information,” or “propaganda.” This is somewhat understandable given the claim in the headline that the Typical King County family can again afford median-priced house (although I doubt Eric was the one that wrote that headline). However, the article itself stuck to the facts: King County’s affordability index has indeed recovered in recent months, thanks to a combination of falling home prices and falling interest rates.
Most of the anger in the comment section seemed to stem from a misunderstanding of what the affordability index actually is. Unfortunately, one of the downsides of the newspaper format is that they are not usually able to delve into a subject like this in depth to the degree that would be necessary to fully explain the underlying concepts to every reader. Hopefully this post is able to fill that hole for some of the confused and upset readers out there.
Additional Resources
- Long-term affordability index back through 1950
- Simple Affordability Calculator
- Additional posts on the subject of affordability
Data Sources
- Median Single-Family Home Price: Northwest Multiple Listing Service
- Median Household Income: Washington State Office of Financial Management
- Interest Rates: United States Federal Reserve
*The Seattle Times article says that the WCRER uses 25% of income in their calculations, but I have always used 30% as it is the more standard measure of “affordable” and my calculations tend to match pretty closely to theirs.
