As of February, the monthly payment for the median-price single-family home sold in King County at current mortgage rates was $3,945. The good news: This is down from an eye-watering $4,758 in October. The bad news: It’s up dramatically from just a year prior, and 59% higher than what we saw at the peak of the previous housing bubble…
Tag: affordability
Home prices are finally falling around Seattle—more than most places in the nation
Let’s check up on what’s happening with the Seattle-area housing market in early 2023, shall we?
So… what the heck is going on with the Seattle housing market?
Since we’ve been gone for so long, I thought I’d start back up with somewhat of an overview post. Let’s just take a look at what’s going on in the Seattle-area (King County) housing market recently.
One of the biggest topics on everybody’s mind lately is home prices, so let’s start there…
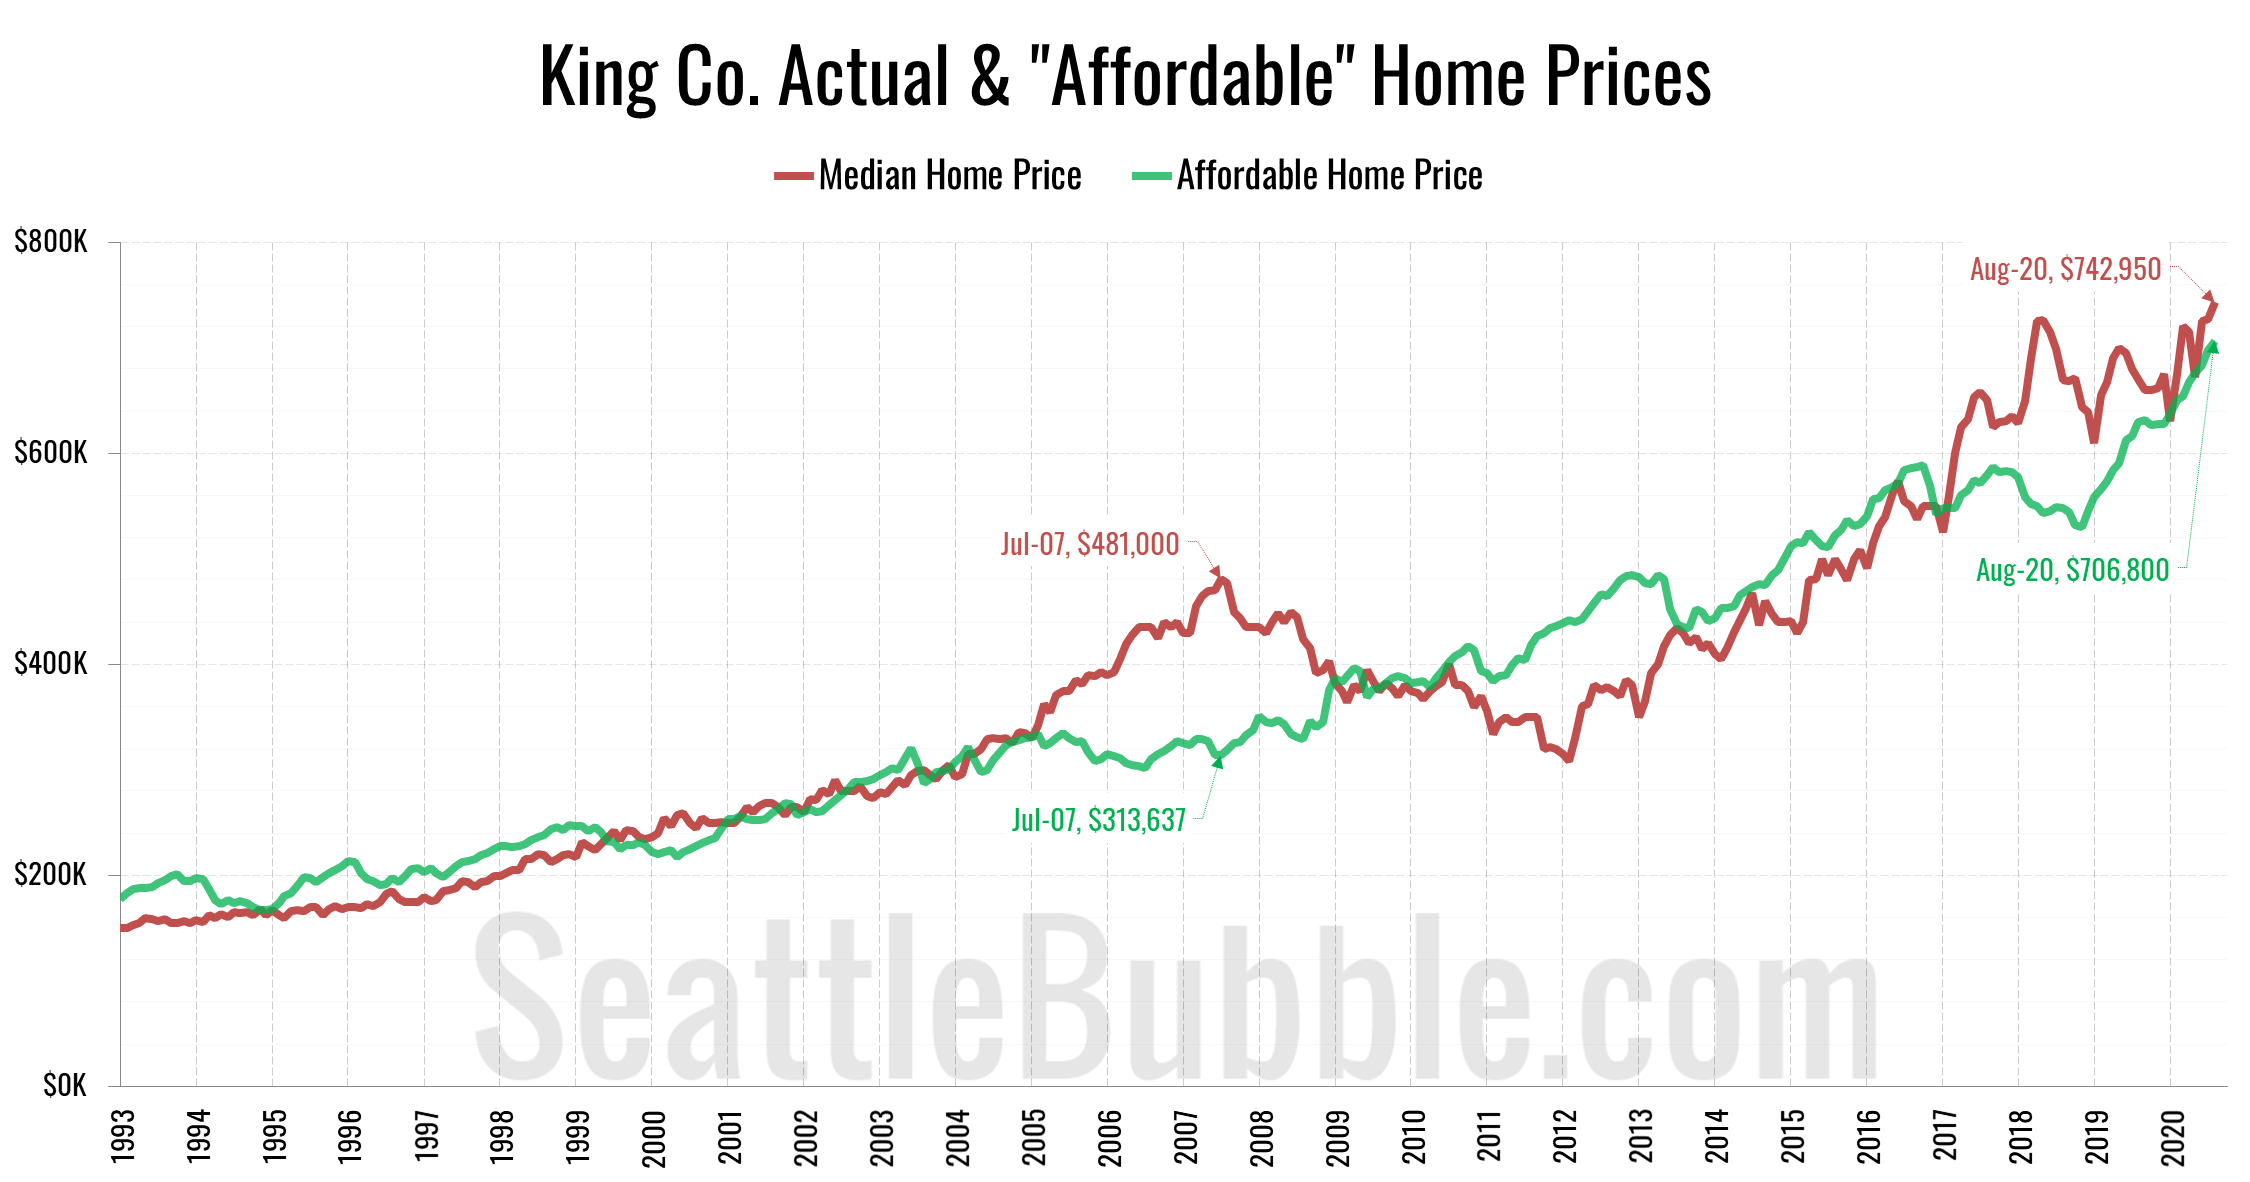
“Affordable” home price shot up 33% in less than two years
The “affordable” home price has shot up from $530,359 in November 2018 to an all-time high of $706,800 as of August. The current “affordable” home price in King County would have a monthly payment of $2,365…
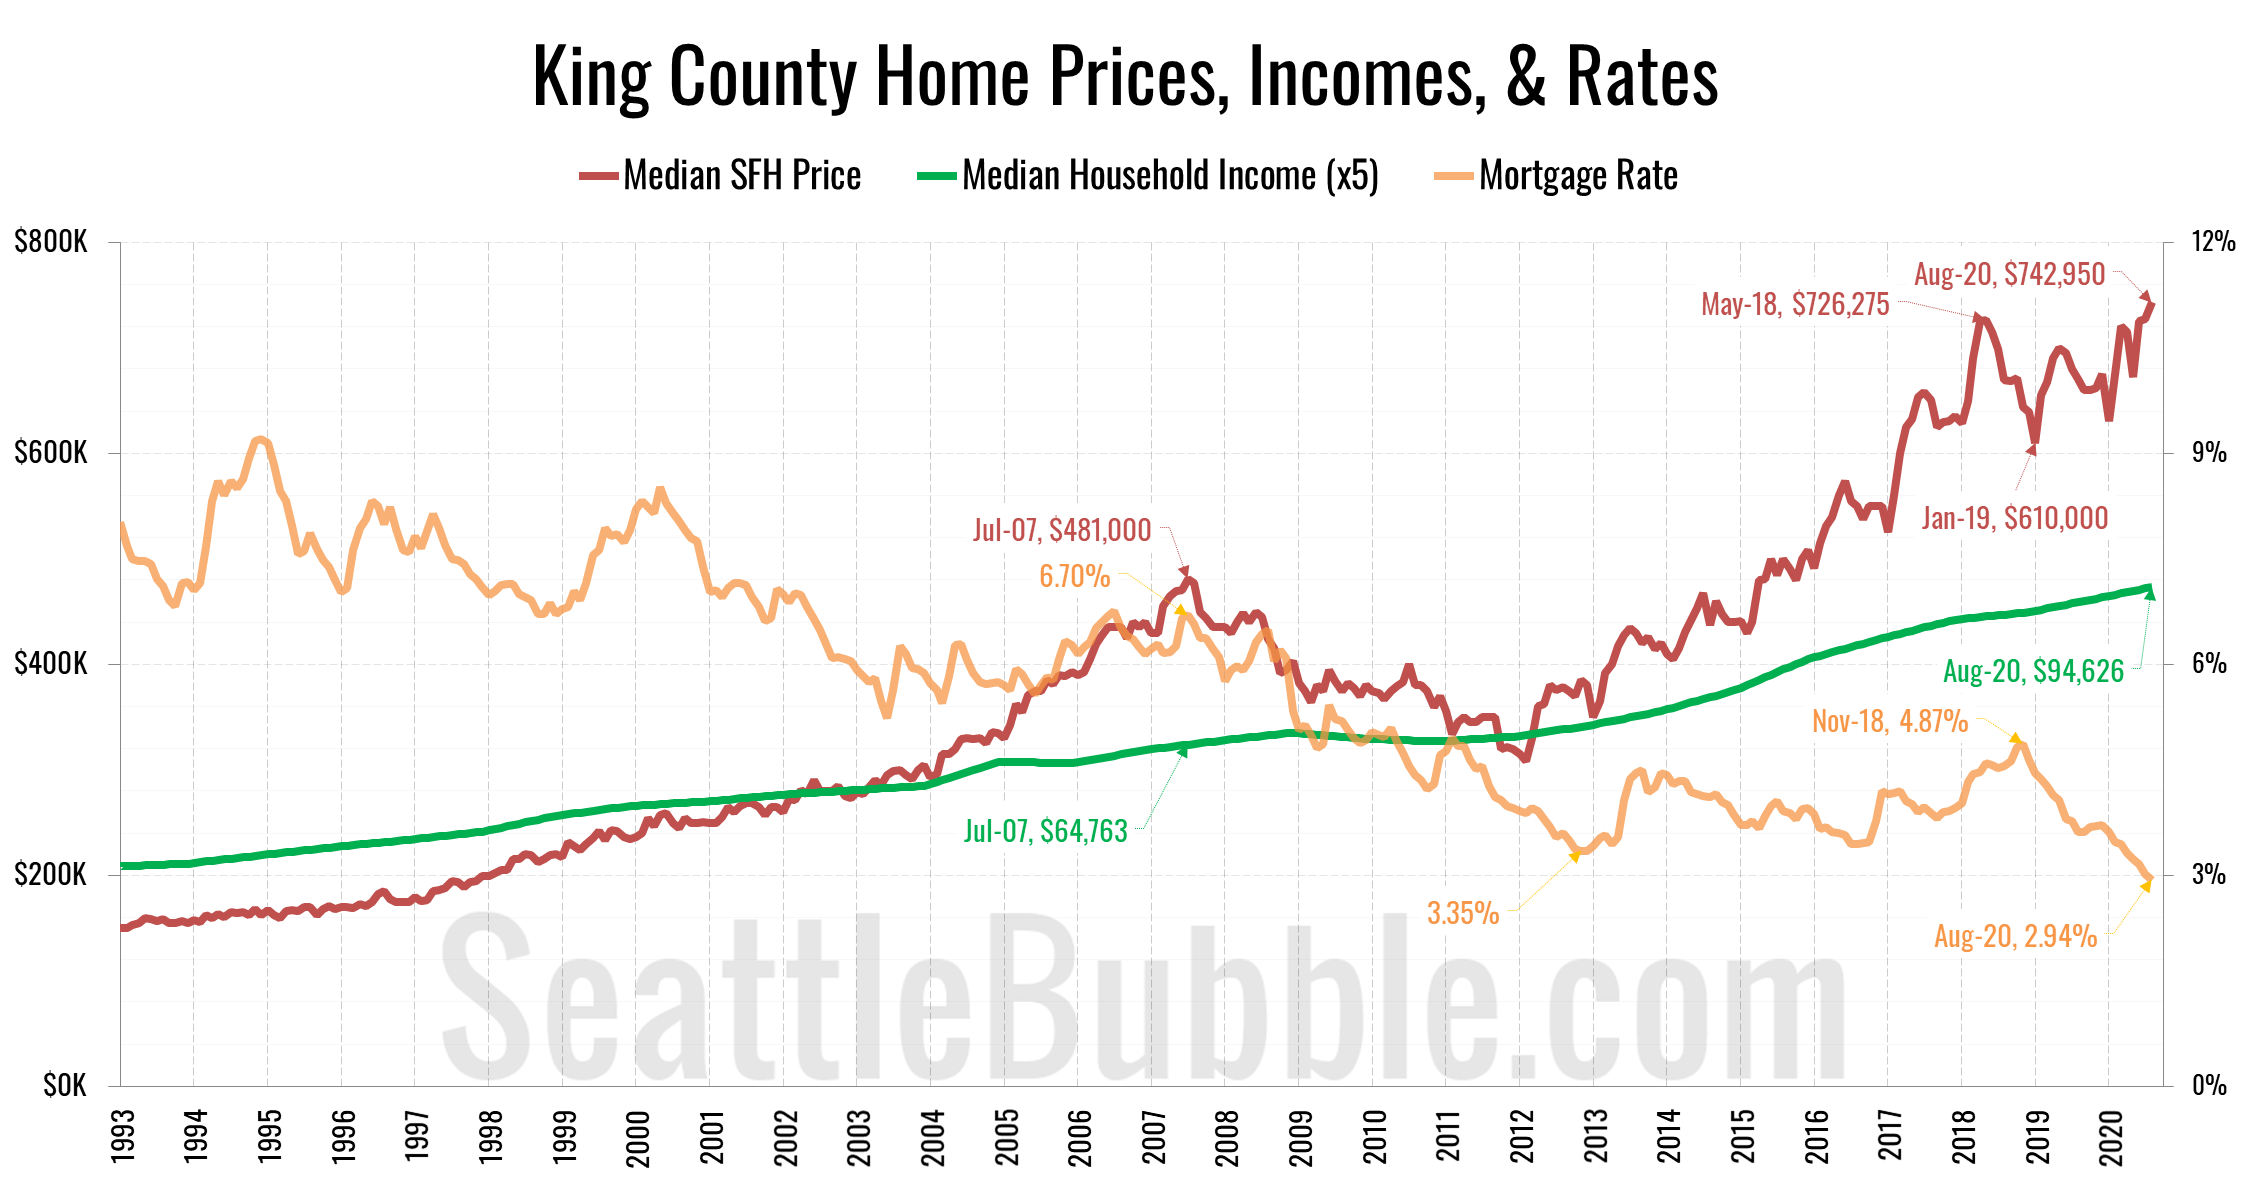
Plunging mortgage rates held off a Seattle home price crash
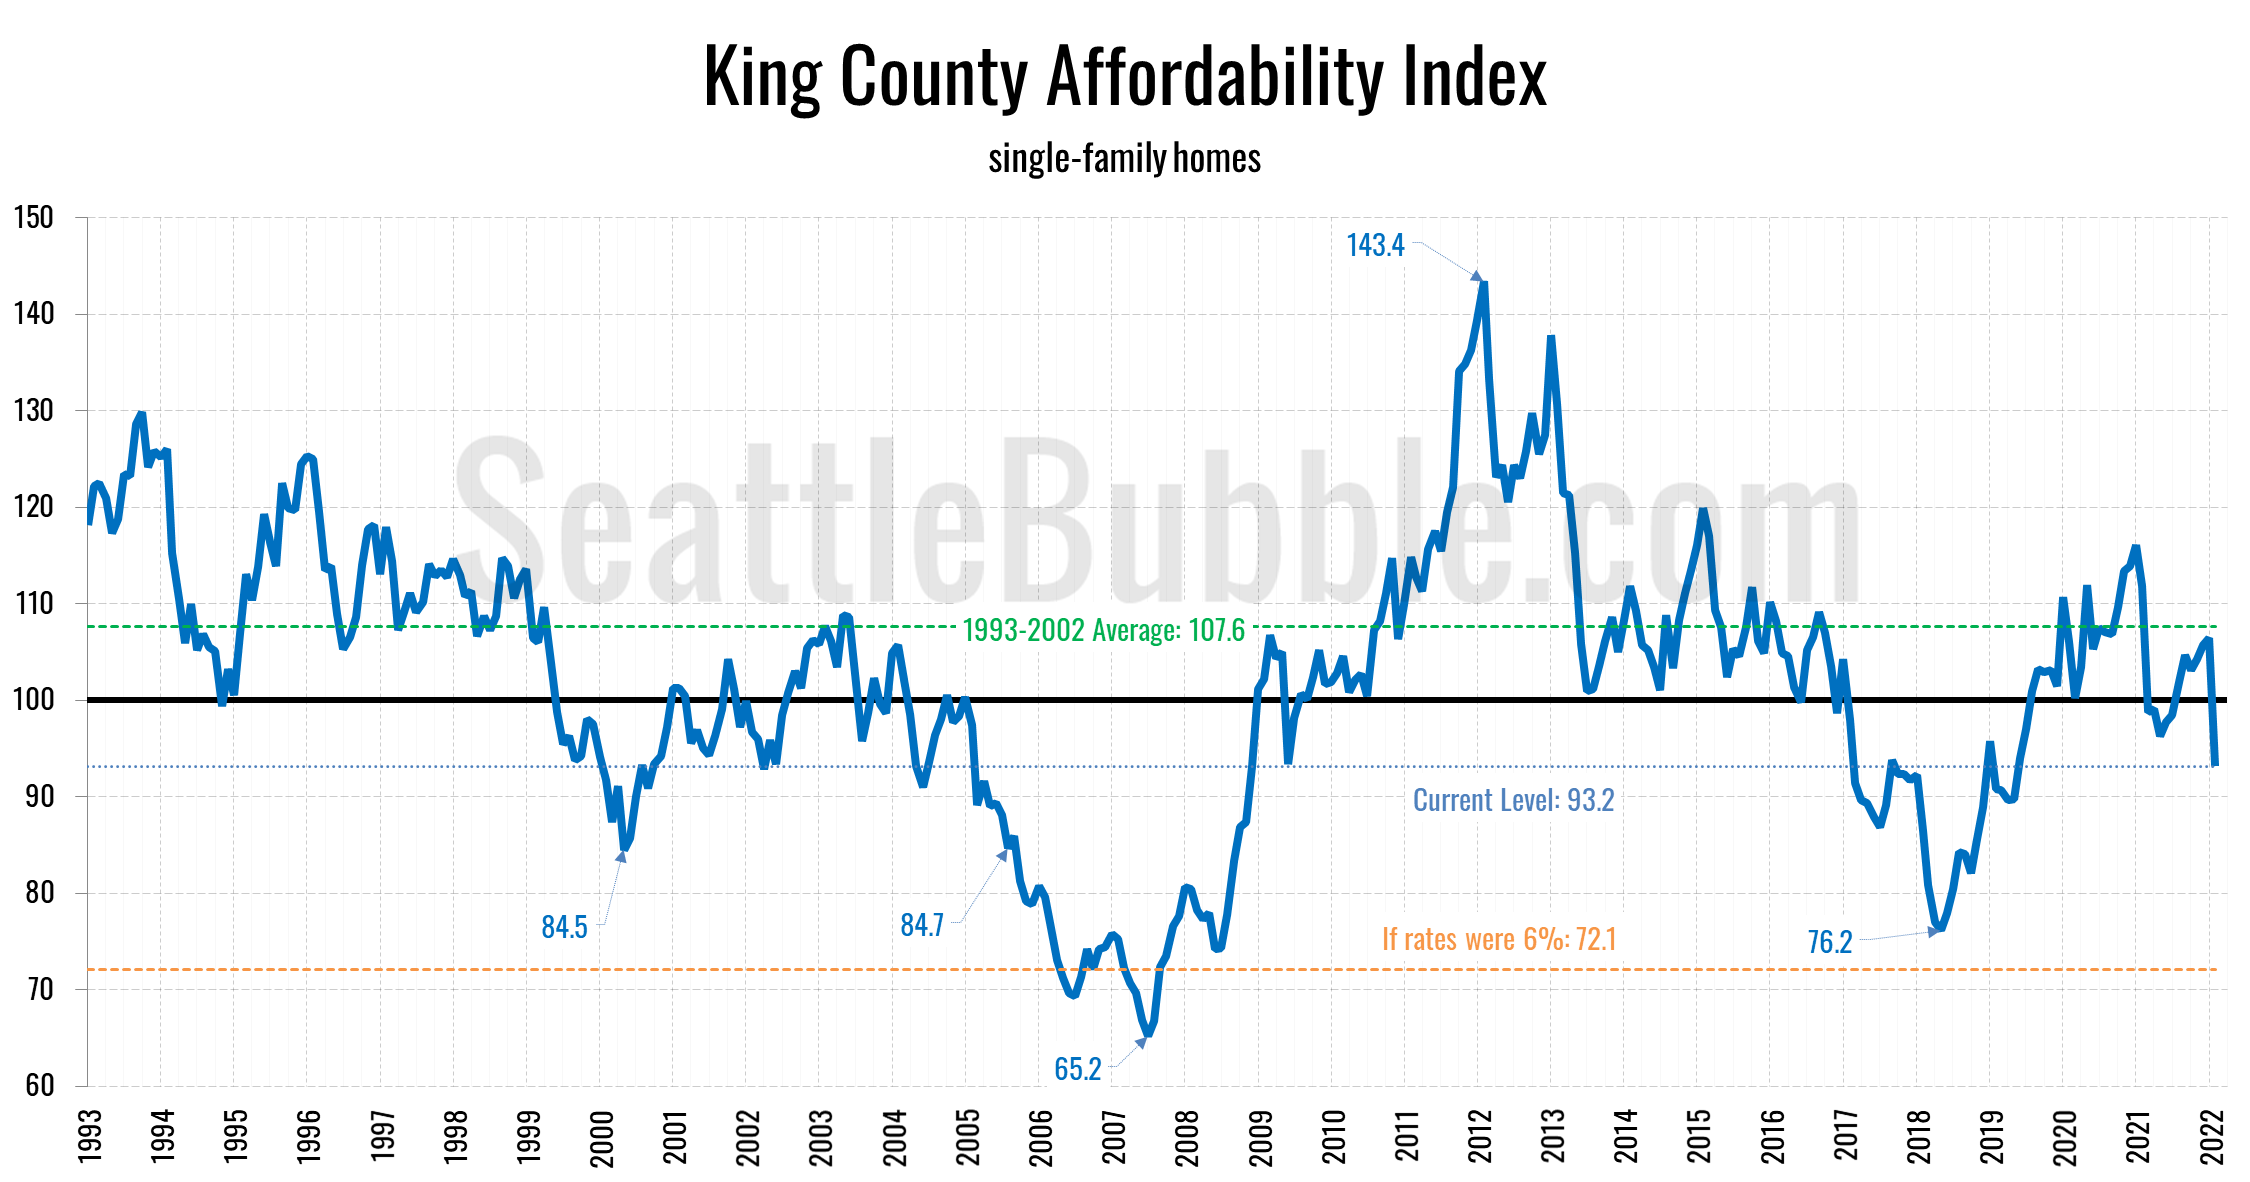
It’s been quite a while since we’ve had a look at our affordability index charts for the counties around Puget Sound, so let’s have a look at those charts…


