Since we’ve been gone for so long, I thought I’d start back up with somewhat of an overview post. Let’s just take a look at what’s going on in the Seattle-area (King County) housing market recently.
One of the biggest topics on everybody’s mind lately is home prices, so let’s start there. The median price of single-family homes sold in King County in February was $857,750, up 14% from a year earlier.
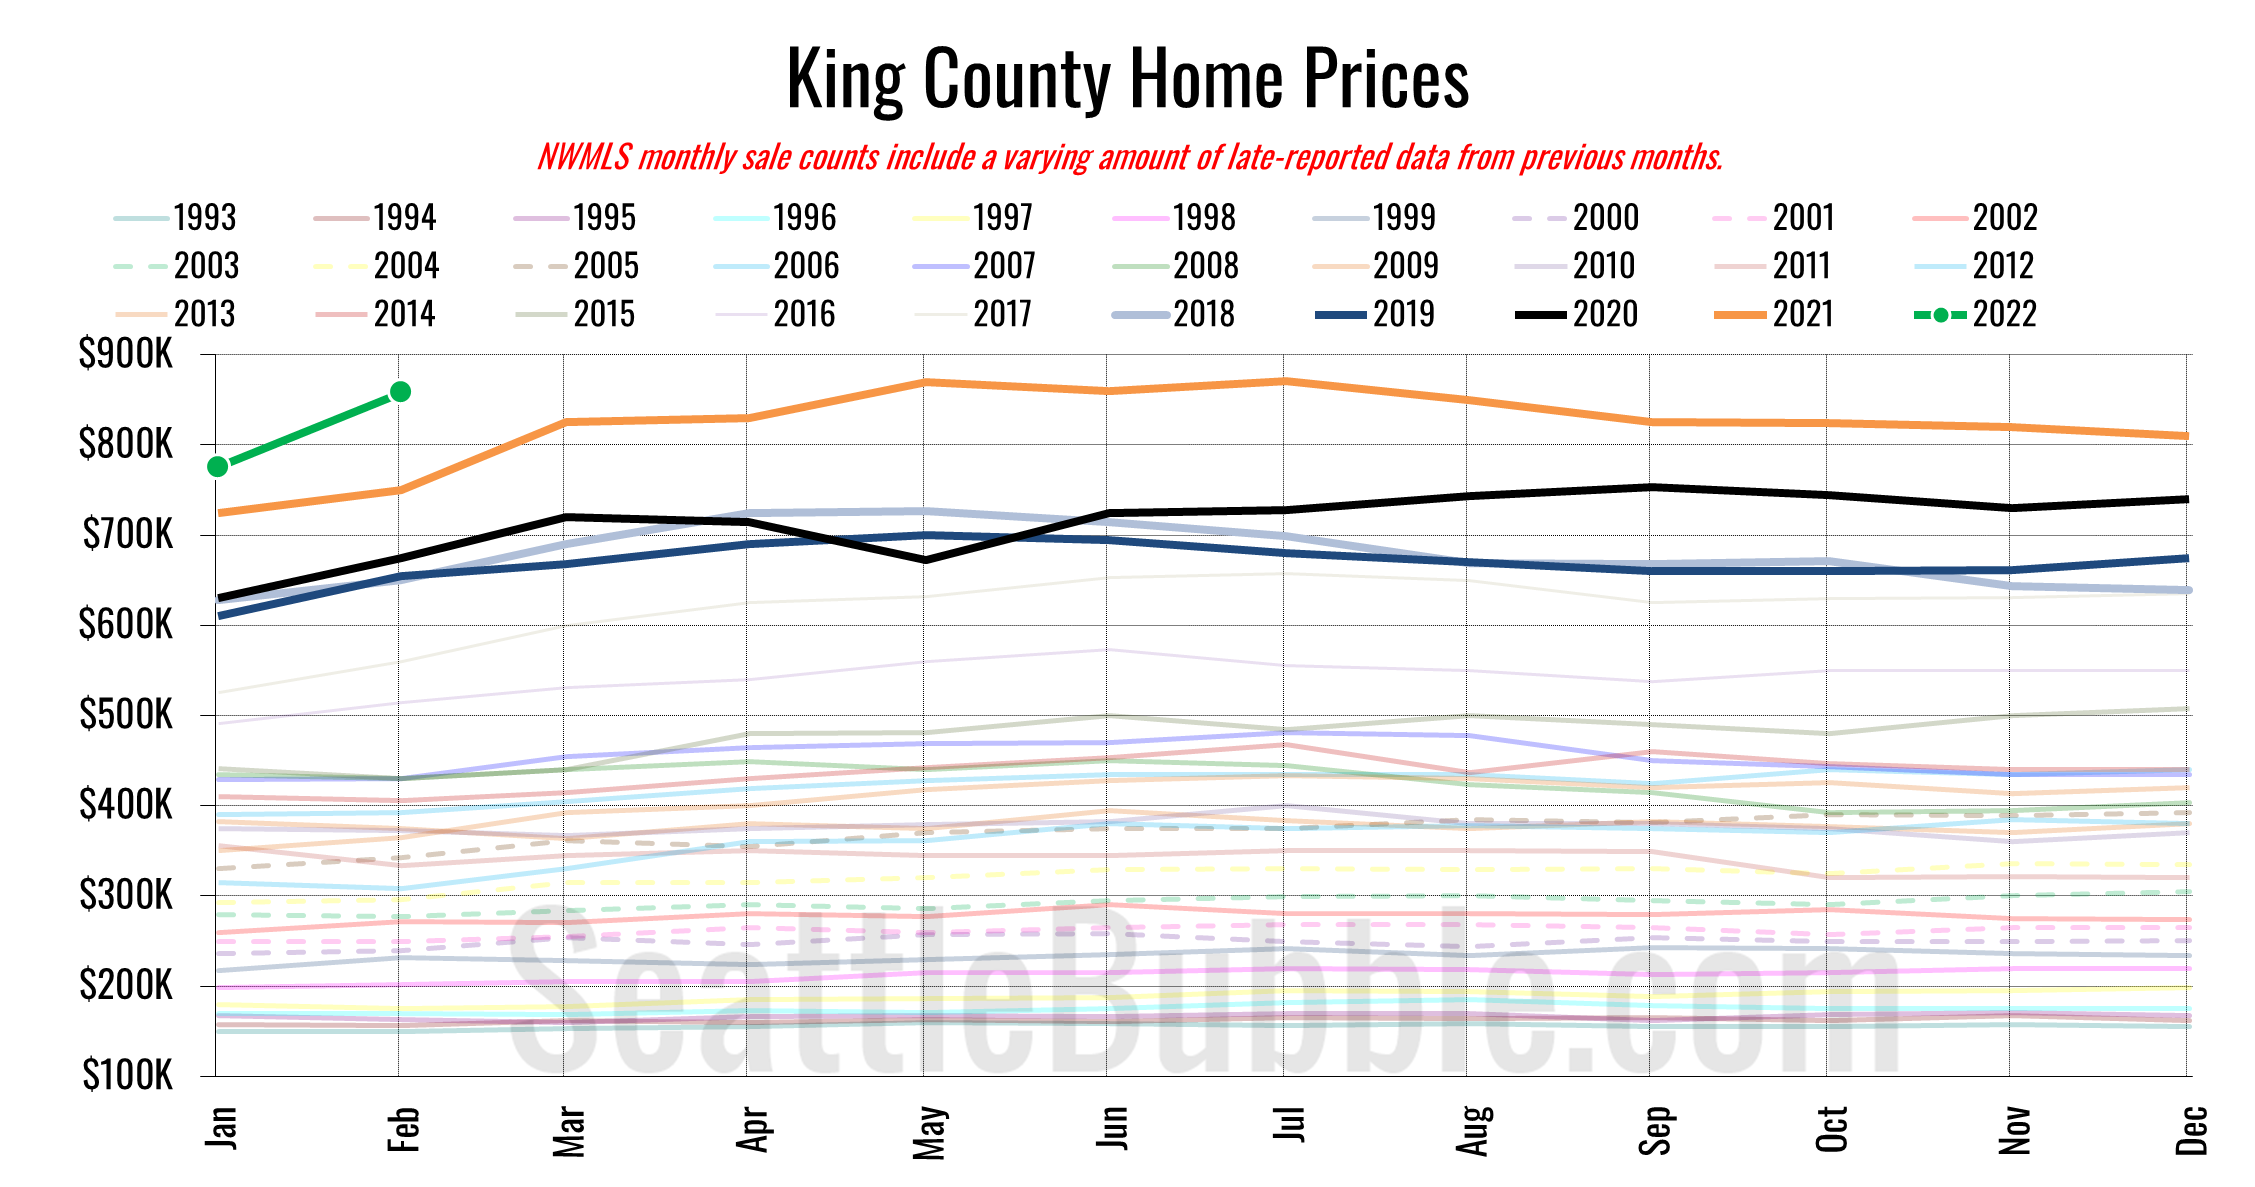
As you can see, prices are down slightly from the all-time high of $871,000 back in July, but over the past few years they have really shot up at a ridiculously fast pace. That said, home affordability here isn’t nearly as awful as you might expect. Remember that an affordability index of 100 means that the median household income is spending 30% of their income on the monthly mortgage payment for the median-priced home. An index below 100 means it would take more than 30% of income, above 100 means it would take less than 30%.

Over the past five years, home prices in King County have shot up around 50%, and incomes are up 38%. Rising incomes weren’t enough to keep the affordability index from nosediving in 2017 and early 2018. However, mortgage rates falling from a recent high of 4.87% in November 2018 to an all-time low of 2.68% in December 2020 pushed the affordability index back up above the “affordable” level of 100… until rates started to shoot back up over the past couple of months, that is.
I’ll be keeping a close eye on this chart as rates are expected to continue to climb throughout 2022.
The other big issue for the housing market right now is supply. I’ll be diving deeper into this topic in the coming weeks, looking at actual homebuilding vs. population, but for now let’s just look at the for-sale market. Here’s our chart of months of supply for single-family homes in King County.

It’s interesting to note that months of supply was creeping up toward a more balanced market in 2018, around the same time that the affordability index was nearing an all-time low. I’m sure this is no coincidence. Right now though, we’ve got close to the lowest supply ever.
Last month held some possibly good news for buyers looking for more choices and less competition, as new listings were higher than they’ve been in February five of the past six years, pending sales were at their lowest point in the past three years, and closed sales hit an 8-year low.


That said, we’re a long way from getting back to anything even remotely resembling “normal” when it comes to how many homes are on the market. End-of-month inventory is still close enough to zero that it’s nearly a rounding error.

So what does it all mean? Well, in short, this market sucks for anyone trying to buy a home right now.
As mentioned earlier, I’m planning to dig deeper into the larger issue of housing supply, and I’m also working on a post with my thoughts on whether we’re currently in “housing bubble 2.0” and what might happen over the next few years.
If you’re a Seattle Bubble Member, the full data for all of these charts and more are uploaded to the members-only data repository.
Want to join a conversation about this or other local real estate topics? We’re on Twitter at @SeattleBubble.