Now that August is behind us, let’s have a look at the monthly stats preview. Most of the charts below are based on broad county-wide data that is available through a simple search of King County Records. If you have additional stats you’d like to see in the “preview,” drop a line in the comments and I’ll see what I can do.
Here’s your preview of August’s foreclosure and home sale stats:
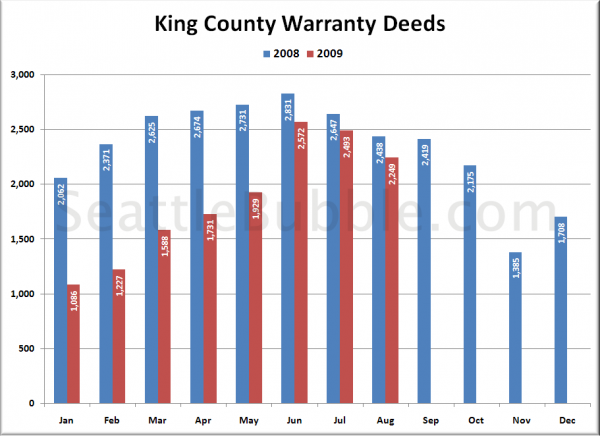
First up, total home sales as measured by the number of “Warranty Deeds” filed with the county:
County sales as measured by warranty deeds were down about 8% from last year in August, and off 10% from July.
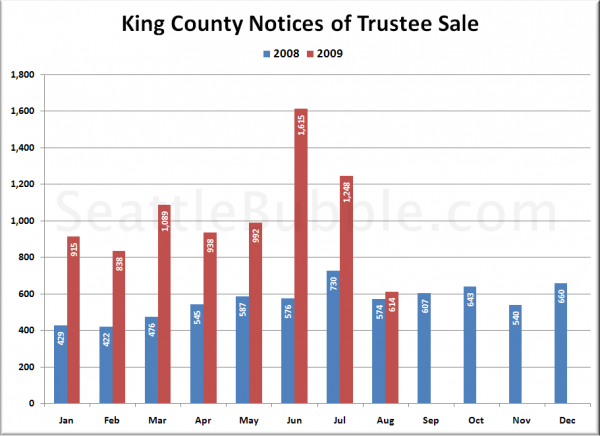
Next, here’s Notices of Trustee sale, which are an indication of the number of homes currently in the foreclosure process:
Looks like exactly what we expected to happen. In our July foreclosure update a few weeks ago, I said “it is likely that we will see a lull in apparent foreclosure activity for a month or two as the newly-legislated time in the pipeline fills up.” Actually I was surprised to see that despite the lull, we still came in slightly higher than last year (+7%).
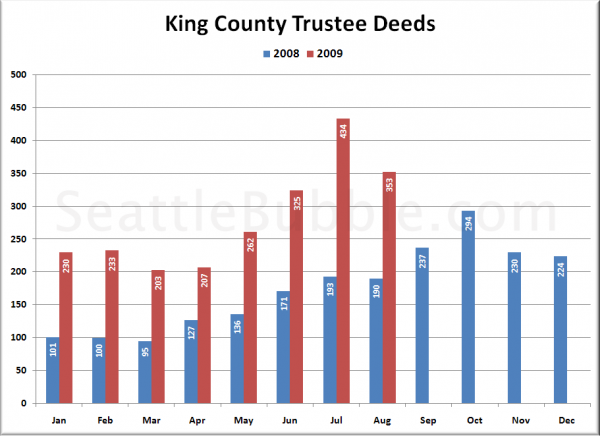
Here’s another measure of foreclosures, looking at Trustee Deeds, which is the type of document filed with the county when the bank actually repossesses a house through the trustee auction process. Note that there are other ways for the bank to repossess a house that result in different documents being filed, such as when a borrower “turns in the keys” and files a “Deed in Lieu of Foreclosure.”
Down from July’s high, but still up 86% from last year. Since actual repossessions lag trustee sale notices by 90 days, we can probably expect to see this drop for the next few months.
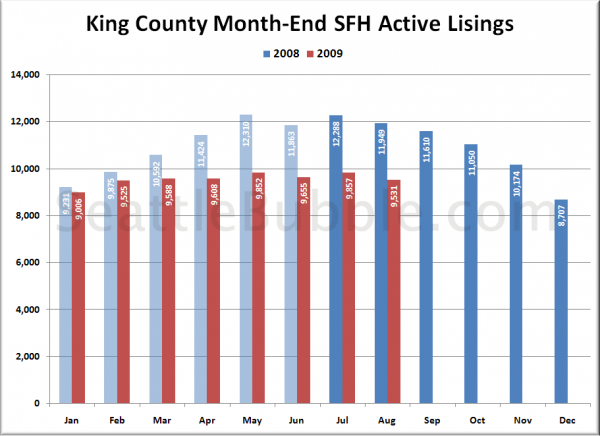
Lastly, here’s an approximate guess at where the month-end inventory was, based on our sidebar inventory tracker (powered by Estately):
If our tracker is close to the official numbers, inventory will decline again slightly, for another year-over-year decrease of about 18%.
It looks like there still aren’t any convincing signs of a strong recovery underway in the sales figures. Stay tuned later this month a for more detailed look at each of these metrics as the “official” data is released from various sources.


