May market stats have been published by the NWMLS. Here’s a link to the NWMLS press release (not live quite yet): Home sales adjusting after surge before tax credits expired.
Home sales during May tapered off around Washington state following a surge of activity in April as buyers hustled to meet deadlines for tax credits.
Northwest Multiple Listing Service brokers reported 5,242 pending sales (mutually accepted offers) last month, a decline of more than 44 percent from April’s total of 9,438 pending sales. Compared to twelve months ago when members tallied 7,160 pending sales of single family homes and condominiums, the volume dipped about 27 percent, but year-to-date figures show 2010 sales are well ahead of 2009.
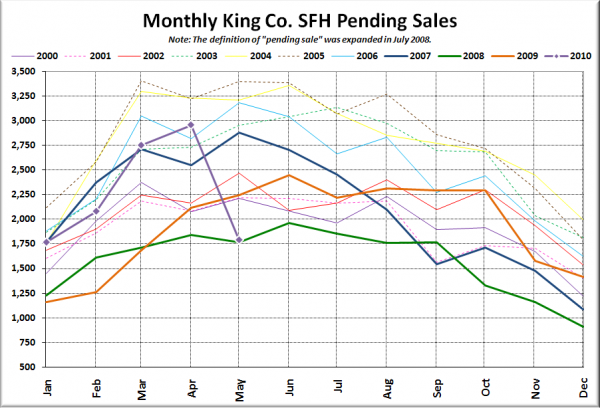
It’s pretty difficult to sugar-coat a 44% month-to-month drop. Here’s what that looks like in chart form:
And keep in mind that over a third of pending sales are still seemingly never turning into closed sales. Get ready for the worst July closed sales on record.
Here’s your King County SFH summary, with the arrows to show whether the year-over-year direction of each indicator is favorable or unfavorable news for buyers and sellers (green = favorable, red = unfavorable):
| May 2010 | Number | MOM | YOY | Buyers | Sellers |
|---|---|---|---|---|---|
| Active Listings | 9,497 | +3.2% | -3.6% |  |
 |
| Closed Sales | 1,766 | +7.6% | +34.6% |  |
 |
| SAAS (?) | 1.43 | -33.3% | -38.5% |  |
 |
| Pending Sales | 1,789 | -39.5% | -20.3% |  |
 |
| Months of Supply | 5.31 | +70.4% | +21.0% |  |
 |
| Median Price* | $379,000 | +1.1% | +1.1% |  |
 |
That is quite the dramatic drop in pending sales. Also, it is worth noting that the number of new listings dropped off quite a bit between April and May as well (from 3,756 to 2,698), when most years see an increase. Apparently many people who were thinking of selling realized that the tax credit was their best chance this year.
Feel free to download the updated Seattle Bubble Spreadsheet, and here’s a copy in Excel 2003 format.
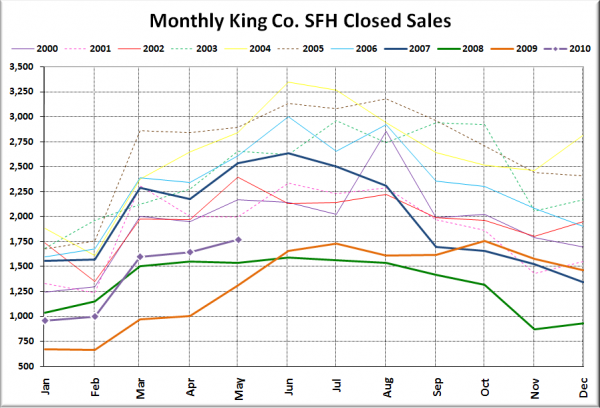
Here’s your closed sales yearly comparison chart:
Just as I predicted last month, we bumped up a little from the 2008 line in May, though the increase was less than I expected. Tax credit buyers have until the end of this month to close if they want to qualify for the free cash, so I expect to see another slight increase this month before we drop off a cliff in July.
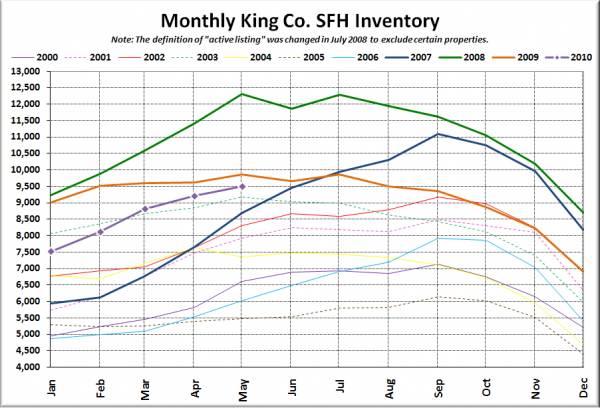
Here’s the graph of inventory with each year overlaid on the same chart.
Still inching toward 2009 inventory levels.
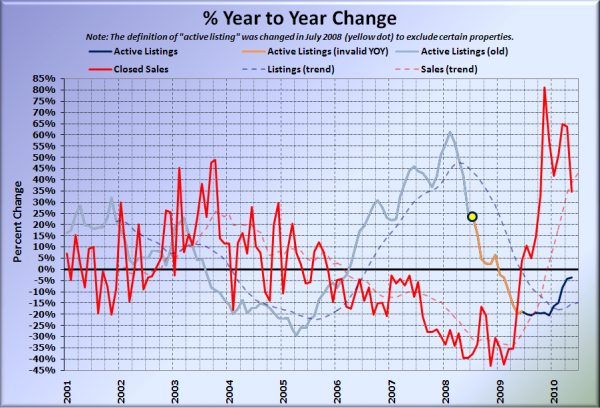
Here’s the supply/demand YOY graph. In place of the now-unreliable measure of pending sales, the “demand” in this chart is represented by closed sales, which have had a consistent definition throughout the decade.
Sales are rapidly dropping off their massive high while inventory approaches zero. Expect the same pattern next month as well.
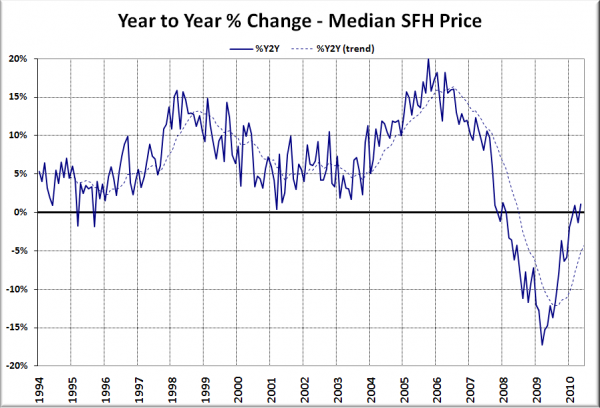
Here’s the median home price YOY change graph:
Nothing really all that interesting here. Last-minute tax credit buyers were probably not the best negotiators in the world.
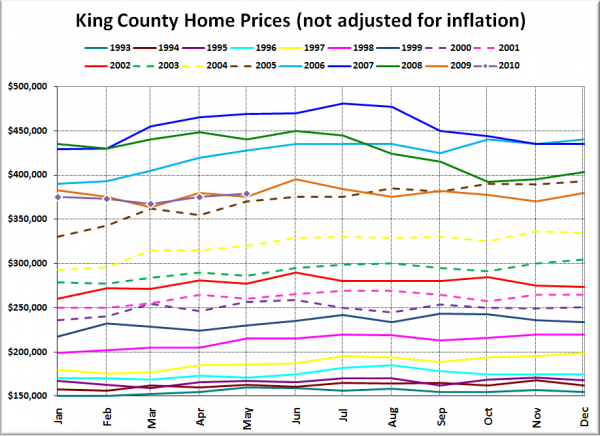
And lastly, here is the chart comparing King County SFH prices each month for every year back to 1994.
Maybe we’ll just hang out here at 2005 prices for the next five years.
Here are the news blurbs from the Times and P-I:
Seattle Times: Local home sales balloon in May thanks to federal tax credit
Seattle P-I: Pending home sales in Seattle tumble as tax credits end
Check back Monday for the full reporting roundup.
