I’ve got one last set of data that I’d like to share on the matter of the NWMLS monthly reports not really reporting what happened during the specified month.
There’s a real estate statistics service called Trendgraphix that puts out monthly reports as well. Since they are plugged directly into the MLS database, they are able to report on the same underlying data as the NWMLS monthly reports. From what I can tell, Trendgraphix does their best to only report what actually happened during a given month. For late-reported sales, they will update the numbers from previous months when they publish each monthly report.
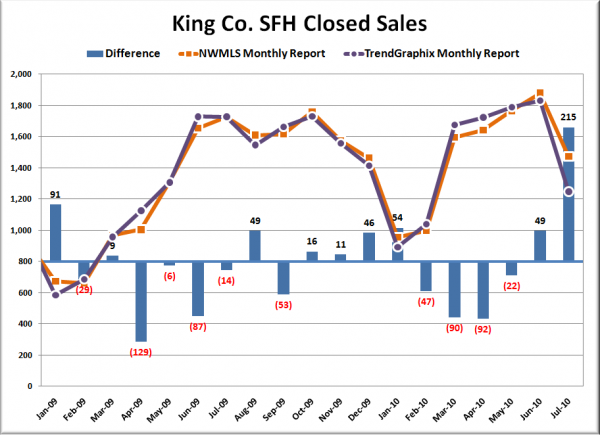
I had a friend with Trendgraphix access go in and pull the last few years of King County closed sales counts for me. Here is what it looks like when you compare the Trendgraphix reports (which are pulling directly from the NWMLS’ own database) to the NWMLS reports:
There has been an ongoing difference between the two for as far back as this data goes, but July 2010 saw far and away the largest variance.
While it may be true that in the long run, the over and under-reporting in the NWMLS reports wash out, that doesn’t change the fact that they are knowingly publishing false information when they claim that there were X home sales closed in a given month, when X includes closings that actually occurred in previous months.
If you just want to look at a long-term chart and get a feel for general trends, the NWMLS monthly reports are fine. However, if you’re trying to get an idea of what is really going on in a specific given month, it would appear that you should look elsewhere.
Previously:
