December market stats have been published by the NWMLS. Here’s their press release: Western Washington home sales during December nearly equals year-ago levels.
“If you were in any mall in Washington state in December, you got the feeling that the economy is headed in the right direction,” said OB Jacobi, president of Windermere Real Estate Company and a member of the board of directors of Northwest Multiple Listing Service. “That increase in consumer confidence is the boost the real estate market needs,” he suggested.
I see. So now we’ve moved from using open house traffic as a gauge of local housing market health to using mall foot traffic. Fascinating.
“Despite the expiration of the tax credit, King County saw about 3 percent more home sales in 2010 than in 2009,” Jacobi noted.
You mean the tax credit that was in effect for half of 2010, and basically half of 2009? Wow, what an accomplishment.
Anyway, let’s have a look at the actual numbers.
NWMLS monthly reports include an undisclosed and varying number of
sales from previous months in their pending and closed sales statistics.
Here’s your King County SFH summary, with the arrows to show whether the year-over-year direction of each indicator is favorable or unfavorable news for buyers and sellers (green = favorable, red = unfavorable):
| December 2010 | Number | MOM | YOY | Buyers | Sellers |
|---|---|---|---|---|---|
| Active Listings | 7,364 | -15.6% | +6.4% |  |
 |
| Closed Sales | 1,458 | +33.5% | -0.3% |  |
 |
| SAAS (?) | 2.00 | -3.1% | +0.5% |  |
 |
| Pending Sales | 1,379 | -15.3% | -2.4% |  |
 |
| Months of Supply | 5.34 | -0.3% | +9.1% |  |
 |
| Median Price* | $370,000 | +2.8% | -2.6% |  |
 |
Feel free to download the updated Seattle Bubble Spreadsheet (Excel 2003 format), but keep in mind the caution above.
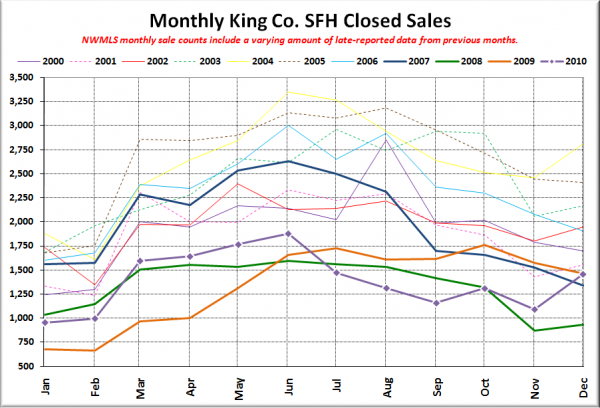
Here’s your closed sales yearly comparison chart:
There’s definitely something fishy going on with the closed sales number being reported here. The 33.5% increase between November and December is over twice as large as the next-largest increase between those months in any year since 2000. The average November to December change in closed sales has been +1.0% between 2000 and 2009. The highest change was +14.3% in 2004. Does anyone have a reasonable explanation for why we would see a sudden surge in sales like this?
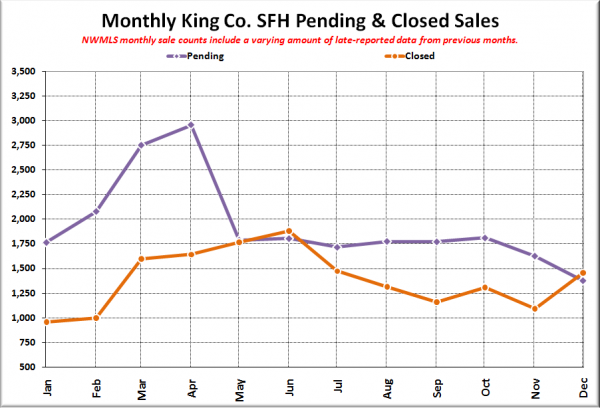
It’s especially hard to believe that something fishy isn’t going on when the 33% MOM surge in closed sales doesn’t follow any similar movement in pending sales. Closed sales surged to their highest point since July (the month after the tax credit expired), while pending sales were flat for the five months following the credit expiration, followed by a predictable seasonal dropoff the last two months.
So what gives?
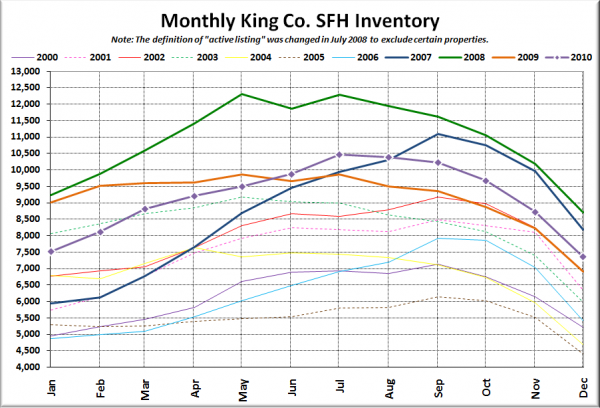
Here’s the graph of inventory with each year overlaid on the same chart.
Same basic story we’ve had the last few months, nothing odd here.
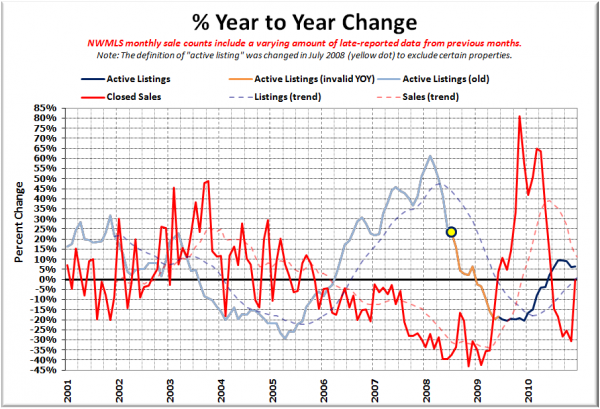
Here’s the supply/demand YOY graph. In place of the now-unreliable measure of pending sales, the “demand” in this chart is represented by closed sales, which have had a consistent definition throughout the decade.
Note the sudden dramatic spike upward in the red line.
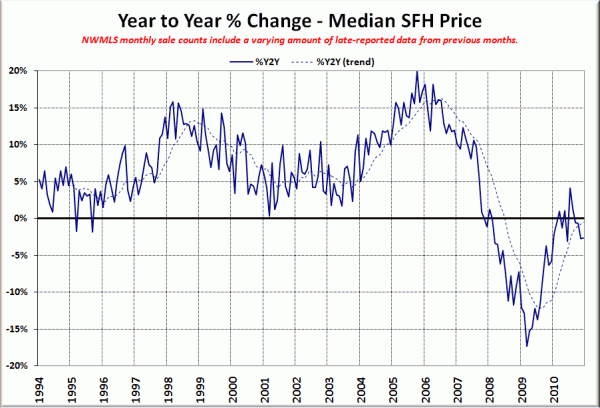
Here’s the median home price YOY change graph:
Still sitting below zero.
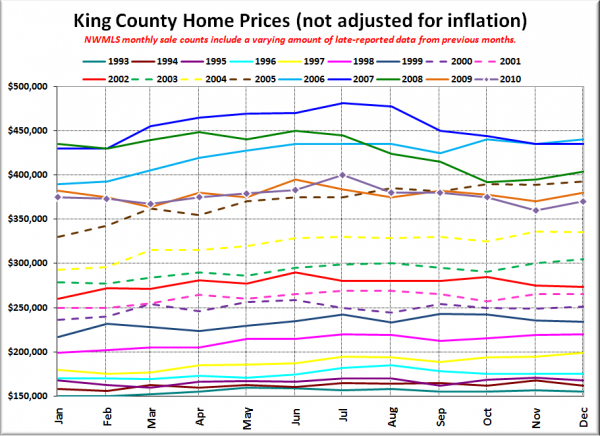
And lastly, here is the chart comparing King County SFH prices each month for every year back to 1994.
Prices followed the same general pattern we’ve seen the last few years, bumping up a bit between November and December. May 2005: $370,500. December 2010: $370,000.
Here’s where news blurbs from other sources go:
Seattle Times: King County home sales in December strongest since summer
Seattle P-I: Home sales still slow, but agents see hope in economy
