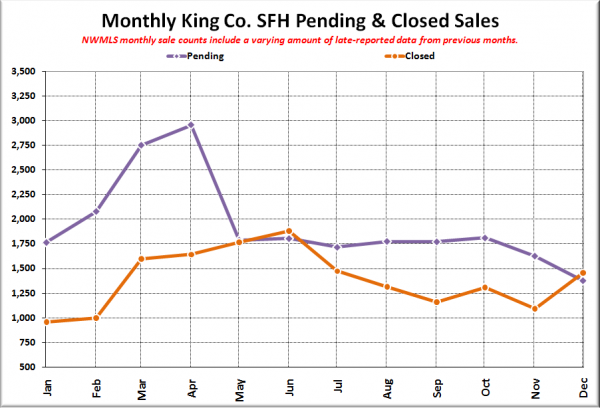
As promised, I’d like to take a little time to go into the odd December bump in closed sales according to the numbers released this week by the NWMLS. Here are the three points I’ll be covering:
- There definitely was a bump in sales in December.
- The NWMLS numbers overstate the size of the bump.
- Much of the real bump came at January’s expense.
We already know that both the warranty deeds filed with King County and the NWMLS data show a seasonally-uncharacteristic increase in sales between November and December. There is also a third data point that confirms a move in that direction: Redfin sale records.
If you do a search of all SFH sale records in King County for the last three months, then split it up small enough to download the results to a spreadsheet, you will find that according to Redfin (which pulls data from the NWMLS as well as public records), there were 1,120 sales in November and 1,346 in December. That represents an increase of about 20% month-over-month. That’s still quite high for this time of year, but does not stretch the boundaries of believability the way a 33% increase does.
So why would the NWMLS data be overstating December’s volume by nearly 10%? My theory is that the 110 or so extra sales in the NWMLS data are probably just another instance of the problem we discussed at length a few months ago with the way they collect and report their data.
The short version is that the number of “closed sales” the NWMLS puts in their monthly reports is not really the number of sales that actually closed during that month. Instead, it is the number of closed sales that NWMLS member agents entered into the system during that month, regardless of what month the sale actually closed. Note the carefully selected wording in their press releases: “MLS members reported 4,430 closings…”
The NWMLS defended this misleading practice in yesterday’s Seattle Times article by stating that “it has reported sales the same way for two decades, and its statistics are accurate.” As if somehow doing the same wrong thing for two decades makes it not wrong anymore.
Here’s why I think that much of the December bump came at January’s expense:
Note that after dropping off a cliff following the expiration of the tax credit (down 40% in a single month), pending sales were basically flat for six months, then dropped nearly 25% in the last two months. Closed sales had a slower descent (down 38% from June to September), but instead of flattening out, have see-sawed a bit in October, November, and December.
While far fewer pending sales eventually end up closing than used to (~75% today vs. 95% a few years ago), every sale that the NWMLS reports as closed has to at some point have been counted as a pending sale. A big boost in December closed sales when there was no simliar boost in pendings during the months prior indicates that sales are just shifting around between months.
My bet is that closed sales drop back down in January, to around 1,100 or so (a 25% MOM drop). Since sales lost 35% MOM between December and January last year, we’ll likely see a double-digit YOY percent gain, but we won’t really know how sales are shaping up for the 2011 “spring buying season” until we see the March numbers.
Full disclosure: The Tim is employed by Redfin.
