Although they have not yet published a press release to their website, August market stats are now available from the NWMLS. Once they post a press release I’ll update this post with a brief snippet. Until then, let’s just go straight to the stats.
NWMLS monthly reports include an undisclosed and varying number of
sales from previous months in their pending and closed sales statistics.
Here’s your King County SFH summary, with the arrows to show whether the year-over-year direction of each indicator is favorable or unfavorable news for buyers and sellers (green = favorable, red = unfavorable):
| August 2013 | Number | MOM | YOY | Buyers | Sellers |
|---|---|---|---|---|---|
| Active Listings | 4,900 | +6.9% | -4.0% |  |
 |
| Closed Sales | 2,560 | -3.3% | +18.4% |  |
 |
| SAAS (?) | 1.31 | +0.2% | +0.9% |  |
 |
| Pending Sales | 2,845 | -5.5% | +8.5% |  |
 |
| Months of Supply | 1.72 | +13.1% | -11.5% |  |
 |
| Median Price* | $430,000 | -0.9% | +13.8% |  |
 |
Feel free to download the updated Seattle Bubble Spreadsheet (Excel 2003 format), but keep in mind the caution above.
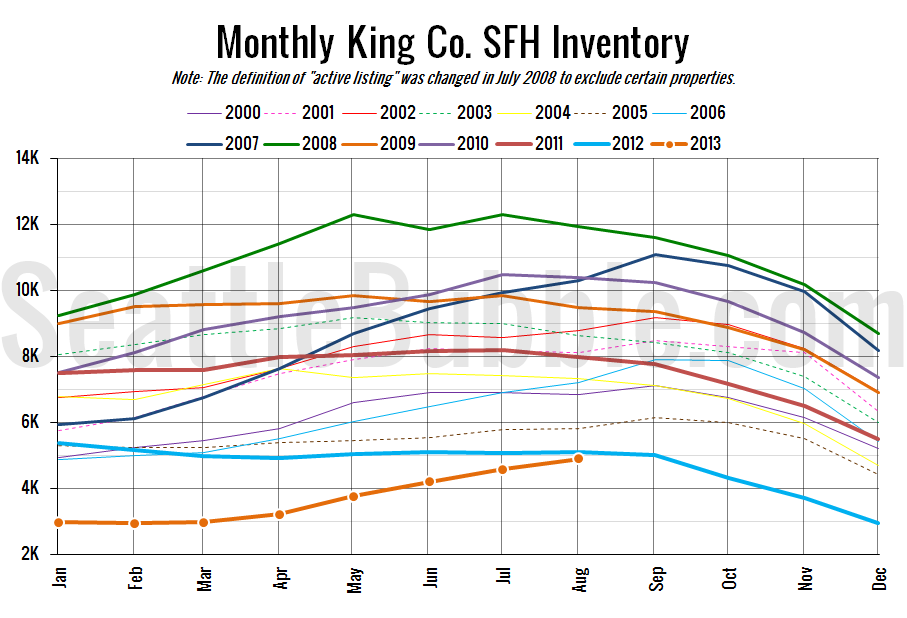
Yet another uptick in inventory, while pending sales fell for the third month in a row. It looks like we’ll probably hit positive year-over-year inventory numbers for King County by next month, one month later than I predicted back in July.
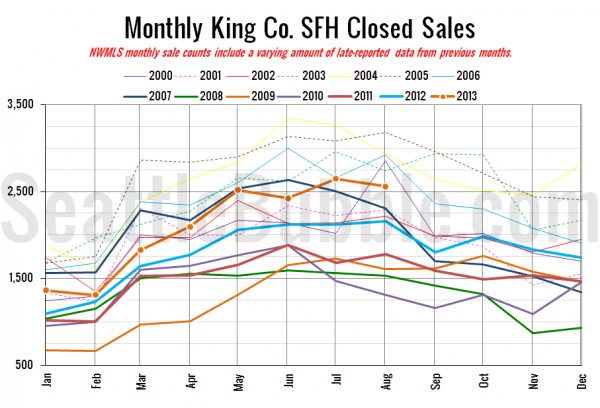
Here’s your closed sales yearly comparison chart:
The July to August change is mixed, with some years up, some down. This year was down, but closed sales still came in at their second-highest level of the year.
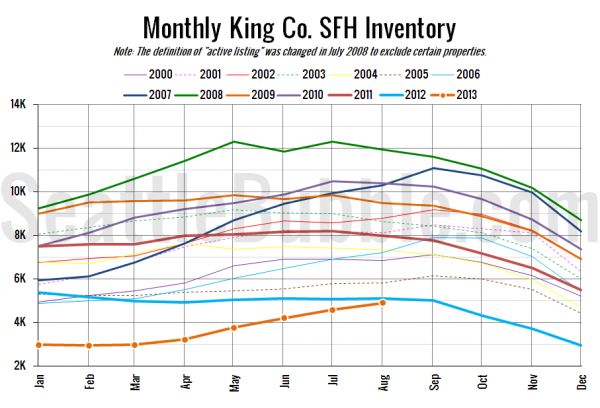
Here’s the graph of inventory with each year overlaid on the same chart.
We didn’t quite make YOY positive this month, but it came close. I think we’ll probably see another decent increase in inventory over the next month, driving us back well into positive territory by the end of September.
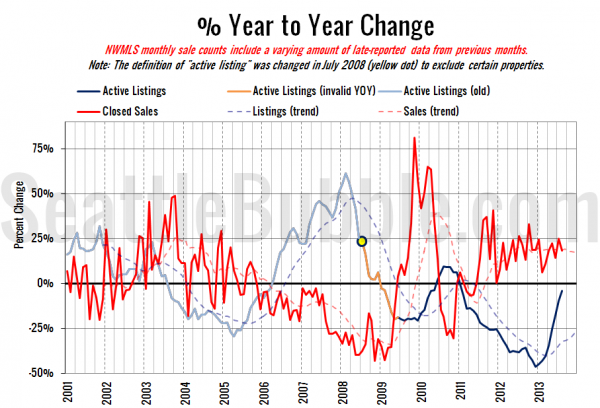
Here’s the supply/demand YOY graph. “Demand” in this chart is represented by closed sales, which have had a consistent definition throughout the decade (unlike pending sales from NWMLS).
Both lines moved closer to zero in August, indicating a slight move toward a more balanced market.
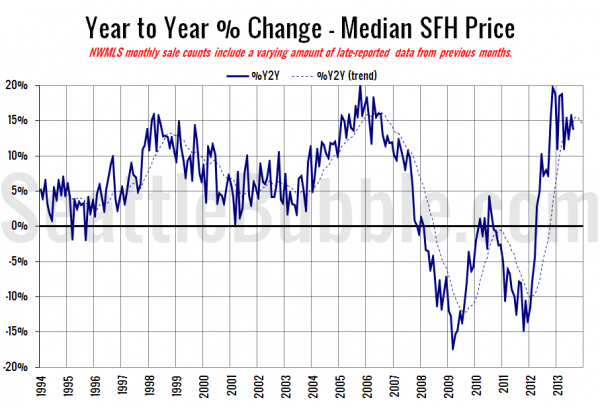
Here’s the median home price YOY change graph:
The median sale price actually fell in August, for the first time in seven months. The decrease was very slight though—just $4,000.
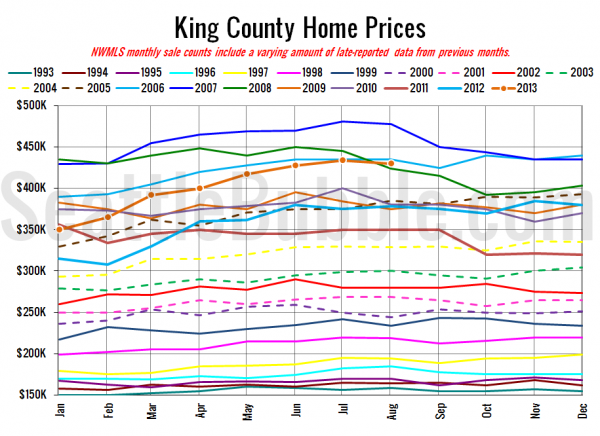
And lastly, here is the chart comparing King County SFH prices each month for every year back to 1994.
August 2013: $430,000
May 2006: $427,950
I haven’t seen any articles about the numbers yet at the Times and P-I, but I’ll update this post when they’re posted.
As usual, check back tomorrow for the full reporting roundup.
[Update]
Oddly the NWMLS site still hasn’t been updated with their press release, but the Times and P-I did post their stories:
Seattle Times: King County home prices snap streak of monthly gains
Seattle P-I: Seattle-area home supply slowly increasing
