With the month of September now in the history books, let’s have a look at our stats preview. Most of the charts below are based on broad county-wide data that is available through a simple search of King County and Snohomish County public records. If you have additional stats you’d like to see in the preview, drop a line in the comments and I’ll see what I can do.
First up, here’s the snapshot of all the data as far back as my historical information goes, with the latest, high, and low values highlighted for each series:
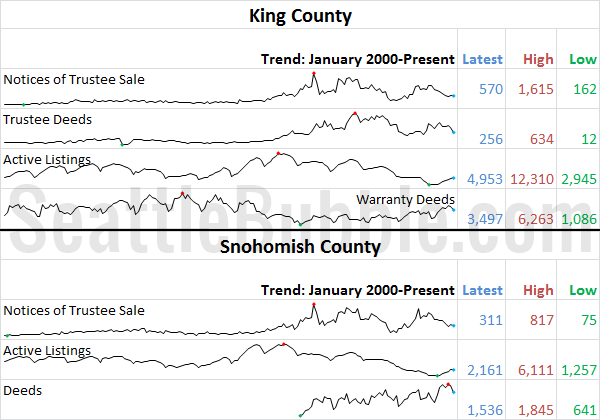
Summary: Inventory increased one more time this year for the sixth consecutive month, while sales took a seasonal dip. Foreclosure notices fell again, but aren’t quite at their lowest point of the year.
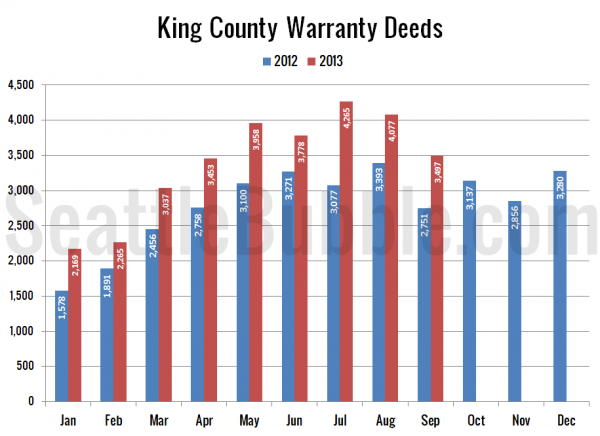
Next, let’s look at total home sales as measured by the number of “Warranty Deeds” filed with King County:
Sales in King County decreased 14.2% from August to September, and were up 27.1% year-over-year, roughly on par with the average year-over-year gains we’ve seen over most of the last year.
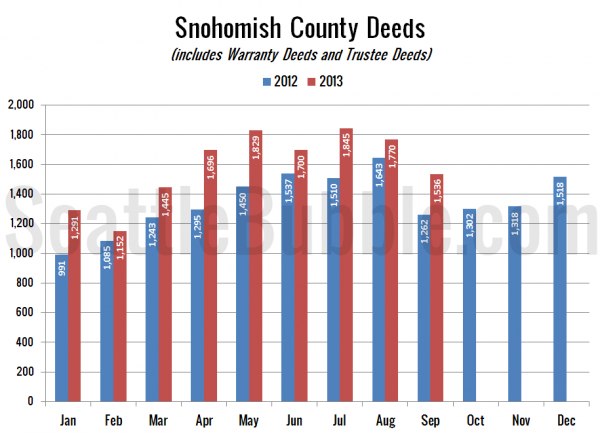
Here’s a look at Snohomish County Deeds, but keep in mind that Snohomish County files Warranty Deeds (regular sales) and Trustee Deeds (bank foreclosure repossessions) together under the category of “Deeds (except QCDS),” so this chart is not as good a measure of plain vanilla sales as the Warranty Deed only data we have in King County.
Deeds in Snohomish fell 13.2% month-over-month and were up 21.7% from September 2012.
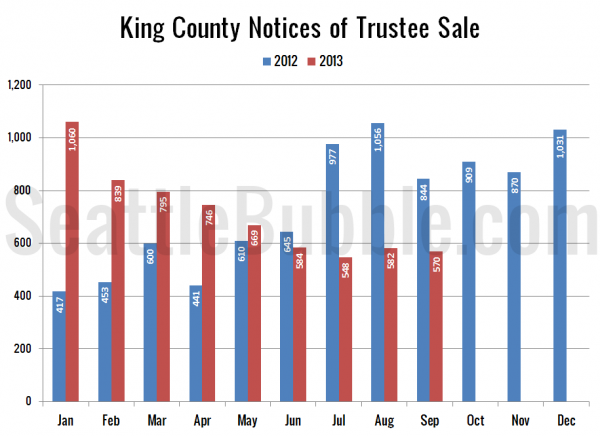
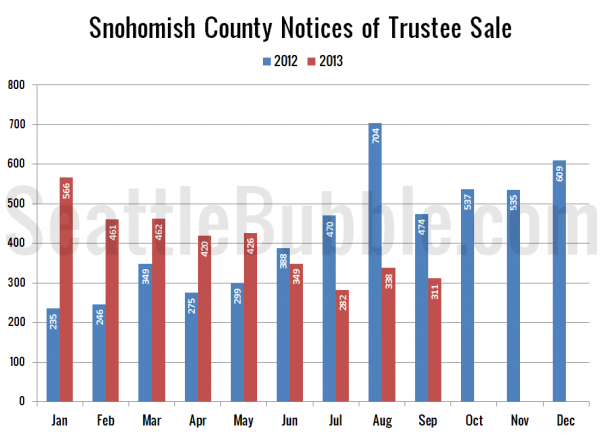
Next, here’s Notices of Trustee Sale, which are an indication of the number of homes currently in the foreclosure process:
Foreclosures in King and Snohomish County both fell slightly between August and September, and were down over 30% from a year ago. King County came in 32.5% below last year’s level, while Snohomish was 34.4% under September 2012.
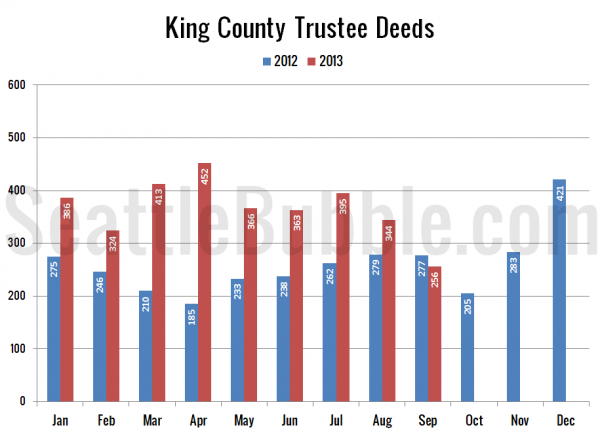
Here’s another measure of foreclosures for King County, looking at Trustee Deeds, which is the type of document filed with the county when the bank actually repossesses a house through the trustee auction process. Note that there are other ways for the bank to repossess a house that result in different documents being filed, such as when a borrower “turns in the keys” and files a “Deed in Lieu of Foreclosure.”
Trustee Deeds fell dramatically from a month ago, and were down year-over-year for the first time since November.
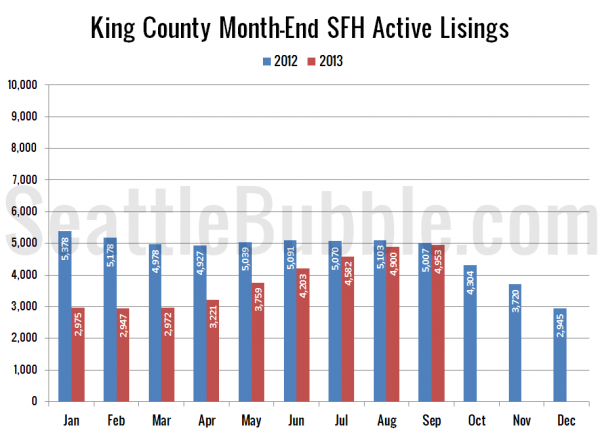
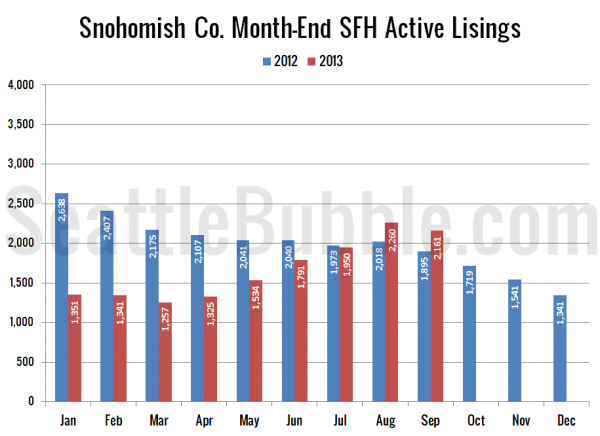
Lastly, here’s an update of the inventory charts, updated with the inventory data from the NWMLS.
We are now at six months of increases in a row for King County. Snohomish County fell slightly month-over-month, but moved further into the black year-over-year. It looks like King County may have just barely fallen short of year-over-year gains. Last year King County inventory fell 1.9% between August and September. This year it gained 1.1% over the same period. In Snohomish County inventory fell 6.3% a year ago and fell 4.4% this year.
Stay tuned later this month a for more detailed look at each of these metrics as the “official” data is released from various sources.
