February market stats were published by the NWMLS earlier today. I had an extremely busy day so I’m only just now getting to posting them. Here’s a snippet from their press release: Home Sales Shrink as Buyers Take a Timeout due to Inventory shortages, Seahawks Playoffs.
Northwest Multiple Listing Service brokers reported 507 fewer pending sales during February than the same month in 2013, but members believe the 6.5 percent decline isn’t due to a shortage of buyers. “If we just had enough homes to sell we would easily be outpacing last year’s pending numbers,” said Mike Gain, CEO and president of Berkshire Hathaway HomeServices Northwest Real Estate. “Locally, we are literally starving for inventory,” he added.
Another industry leader pointed not only to a “severe shortage of homes for sale” in the most sought-after price ranges, but also to the fan frenzy surrounding the Seahawks as a factor in the setback of sales. “The Seahawks’ run to the Super Bowl affected sales,” reported J. Lennox Scott. Since the Super Bowl Championship game, he said listing activity has picked up, resulting in brisk sales activity for the new, but still limited inventory.
Lennox Scott has become a parody of himself.
On with our usual monthly stats.
NWMLS monthly reports include an undisclosed and varying number of
sales from previous months in their pending and closed sales statistics.
Here’s your King County SFH summary, with the arrows to show whether the year-over-year direction of each indicator is favorable or unfavorable news for buyers and sellers (green = favorable, red = unfavorable):
| February 2014 | Number | MOM | YOY | Buyers | Sellers |
|---|---|---|---|---|---|
| Active Listings | 3,173 | +1.3% | +7.7% |  |
 |
| Closed Sales | 1,241 | -5.2% | -5.0% |  |
 |
| SAAS (?) | 1.39 | +28.4% | -1.2% |  |
 |
| Pending Sales | 2,154 | +7.2% | -12.8% |  |
 |
| Months of Supply | 2.56 | +6.9% | +13.4% |  |
 |
| Median Price* | $405,400 | -1.1% | +11.1% |  |
 |
Feel free to download the updated Seattle Bubble Spreadsheet (Excel 2003 format), but keep in mind the caution above.
Pending sales hit year-over-year double-digit losses for the first time in nearly three years, while closed sales shrank by their largest amount in nearly as long. Prices came in well above last year, but unlike last year they fell between January and February.
Median Price January to February 2013: +4.3%
Median Price January to February 2014: -1.1%
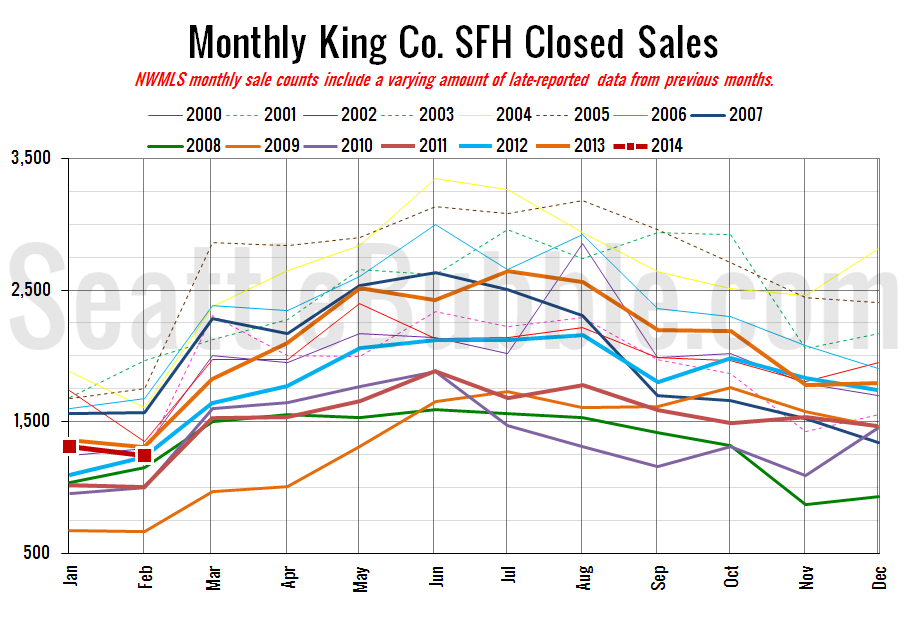
Here’s your closed sales yearly comparison chart:
February home sales came in slightly below last year, in the middle to the lower-end of the pack.
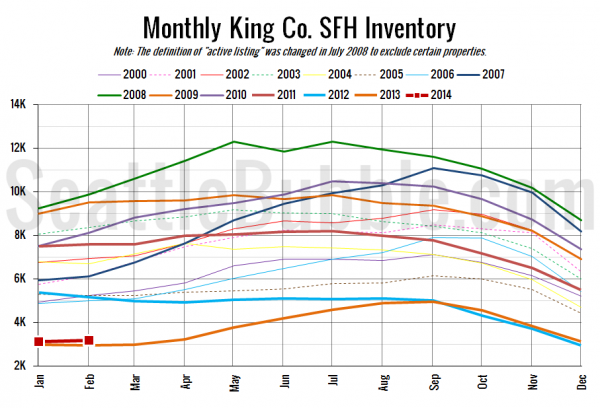
Here’s the graph of inventory with each year overlaid on the same chart.
Second-lowest inventory on record for a February, beating last year just slightly. You would think that with home prices up so much from the bottom two years ago there would be more sellers finally getting “off the fence” and listing their home.
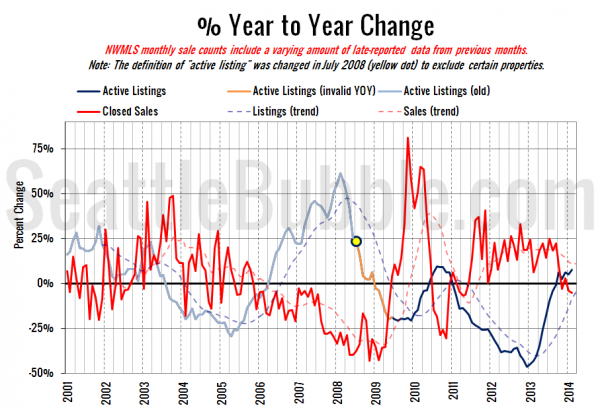
Here’s the supply/demand YOY graph. “Demand” in this chart is represented by closed sales, which have had a consistent definition throughout the decade (unlike pending sales from NWMLS).
Very slightly trending toward a buyer’s market, with the supply trend in the black, and the demand trend in the red. We’ll still need a lot more movement than this before the market actually becomes a buyer’s market.
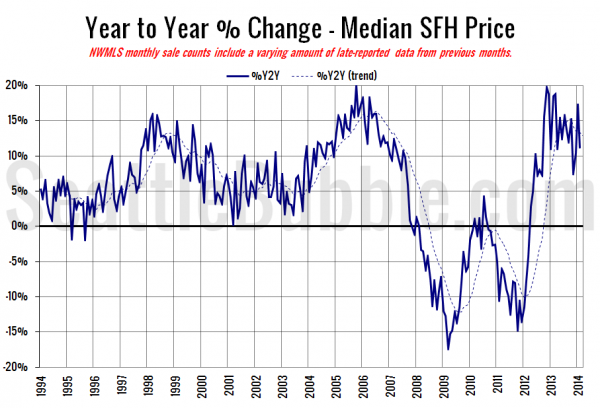
Here’s the median home price YOY change graph:
The median sale price inched down some more in February and year-over-year number dipped.
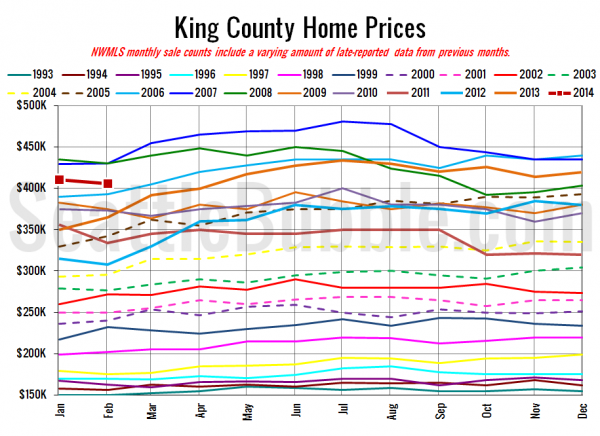
And lastly, here is the chart comparing King County SFH prices each month for every year back to 1994 (not adjusted for inflation).
February 2014: $405,400
March 2006: $405,000
Here are the articles from the Seattle Times and P-I:
Seattle Times: Home prices dip again in King County
Seattle P-I: Fewer home sales, more listings drive up inventory in Seattle area
Check back later tomorrow for the full reporting roundup.
