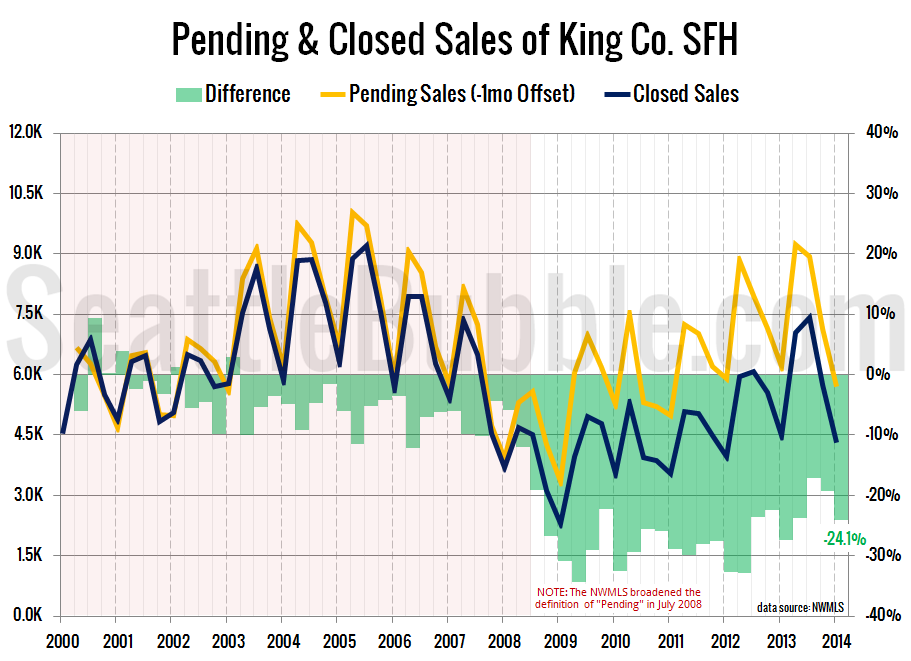
Let’s take a look a the latest data on pending sales volume versus closed sales volume.
For this series I roll the pending sales and closed sales data up by quarter, with pending sales offset by one month. In other words, the first quarter numbers below represent pending sales from December, January, and February and closed sales from January, February, and March.
Although the gap between pending sales and closed sales had been shrinking in the second and third quarter of last year, it opened up a bit in the fourth quarter, and continued to increase in the first quarter, up to 24.1%.
It’s unlikely that this number will ever get back under ten percent with the July 2008 change in the definition of “pending,” but it is somewhat surprising to see it still at nearly one in four. Short sales aren’t really much of a factor anymore, and with as few listings as there are available on the market right now, you would think that buyers would be less likely to back out once they’ve found a home that they’ve gotten an offer accepted on.

