July market stats were published by the NWMLS today. Here’s a snippet from their press release: Western Washington housing market in “recovery mode” but some brokers say it’s still not at full potential.
More sellers listed their homes for sale during July compared to a year ago, but brokers with Northwest Multiple Listing Service say inventory remains “well below” what is considered to be a balanced market. Last month’s pending sales rose slightly from a year ago while prices system-wide increased nearly 6.3 percent.
“Some agents and firms are beginning to feel the summer doldrums, while others are experiencing a definite increase in activity,” observed Diedre Haines, regional managing broker-Snohomish County for Coldwell Banker Bain. Haines, a director with Northwest MLS, described price increases as “healthy, not exorbitant,” adding, “Thankfully we are not seeing signs of a bubble and instead are seeing realistic appreciation.” Nevertheless, she suggested sellers who overprice their properties can face disappointing consequences.
How do you know when the real estate market might be facing a bubble? Wait for agents to say “there are no signs of a bubble.” I’d say that over two years of home price appreciation in excess of five percent is definitely cause for some concern on that front. I’ll be exploring this in more detail later this month as we dive into the fundamentals once again.
For now, it’s on with our usual monthly stats.
NWMLS monthly reports include an undisclosed and varying number of
sales from previous months in their pending and closed sales statistics.
Here’s your King County SFH summary, with the arrows to show whether the year-over-year direction of each indicator is favorable or unfavorable news for buyers and sellers (green = favorable, red = unfavorable):
| July 2014 | Number | MOM | YOY | Buyers | Sellers |
|---|---|---|---|---|---|
| Active Listings | 4,862 | +9.2% | +6.1% |  |
 |
| Closed Sales | 2,666 | +7.7% | +0.7% |  |
 |
| SAAS (?) | 1.35 | -4.5% | +3.9% |  |
 |
| Pending Sales | 2,901 | -8.6% | -3.6% |  |
 |
| Months of Supply | 1.82 | +1.4% | +5.4% |  |
 |
| Median Price* | $468,000 | +3.2% | +7.8% |  |
 |
Feel free to download the updated Seattle Bubble Spreadsheet (Excel 2003 format), but keep in mind the caution above.
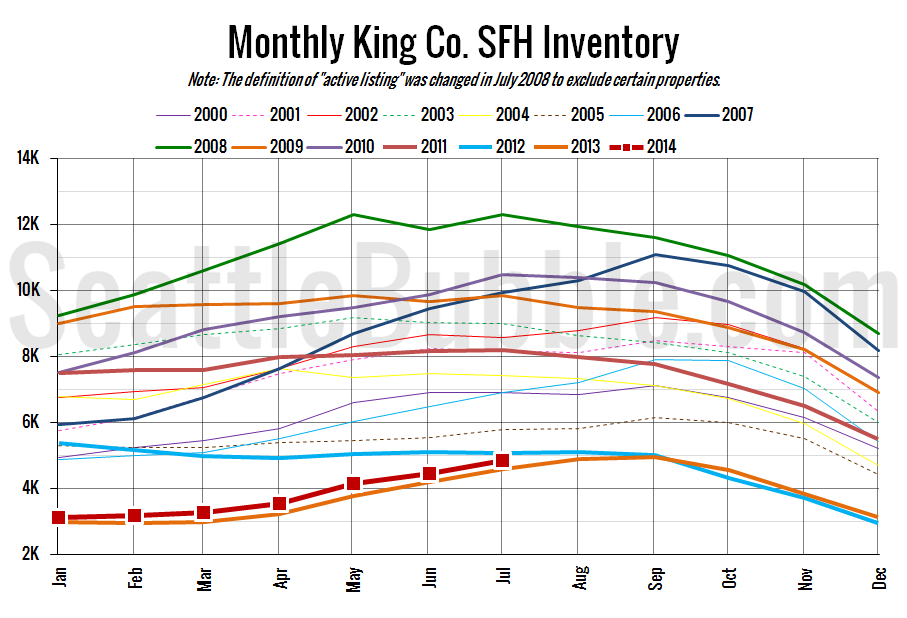
Inventory continues to inch up, and looks to be on track to beat 2012 in August. Closed sales just barely beat last year’s levels while pending sales dipped year-over-year. Meanwhile, prices hit their highest July level since the peak in 2007.
Median Price June to July 2013: +1.5%
Median Price June to July 2014: +3.2%
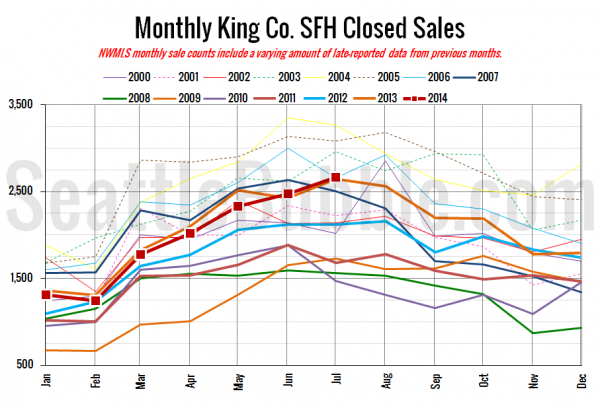
Here’s your closed sales yearly comparison chart:
Sales moved up from June, but not by quite as much as they did last year (+7.7 percent vs. +9.3 percent). However, the increase was still enough to keep sales just barely above last year’s levels.
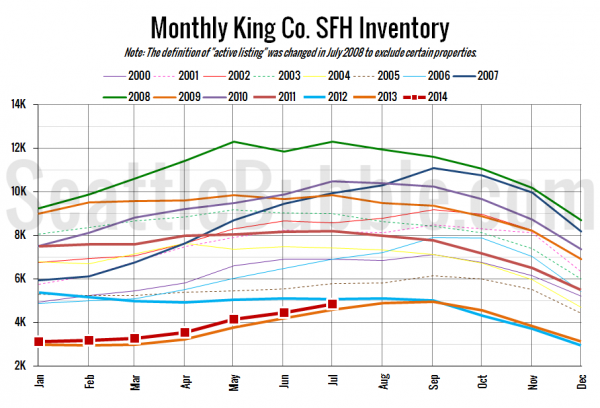
Here’s the graph of inventory with each year overlaid on the same chart.
Inventory continues its slow climb, and looks like it may surpass the 2012 level as early as this month.
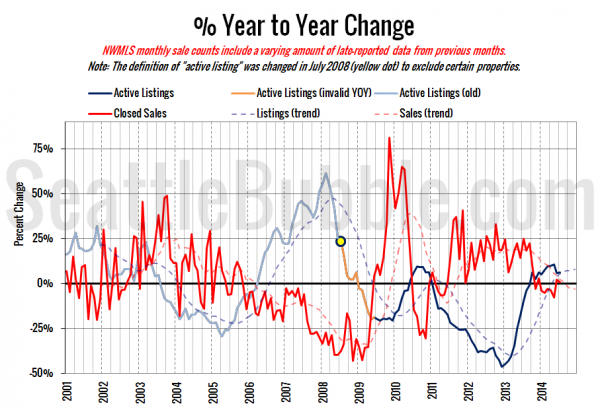
Here’s the supply/demand YOY graph. “Demand” in this chart is represented by closed sales, which have had a consistent definition throughout the decade (unlike pending sales from NWMLS).
Not much change from last month, but things did just slightly turn back in buyers’ favor.
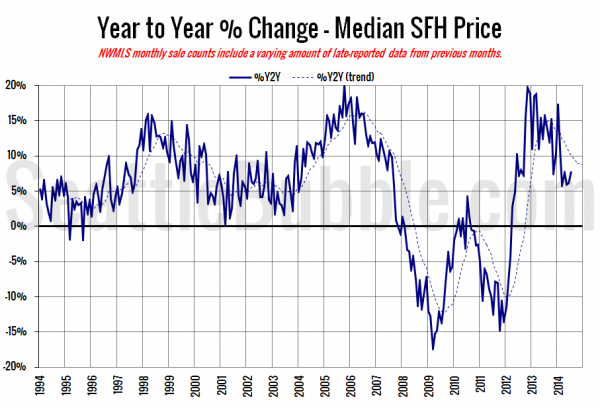
Here’s the median home price YOY change graph:
The year-over-year growth in median price bumped up a bit this month to its highest level since February. We’re currently sitting at 26 straight months of year-over-year home price gains in excess of five percent.
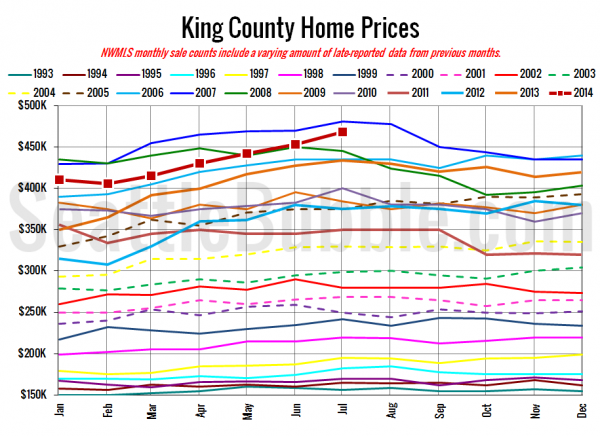
And lastly, here is the chart comparing King County SFH prices each month for every year back to 1994 (not adjusted for inflation).
July 2014: $468,000
May 2007: $469,000
Here are the articles from the Seattle Times and P-I:
Seattle Times: King County home prices up 7.8 percent for the year
Seattle P-I: Home supply, prices rose in July
Check back tomorrow for the full reporting roundup.
