May market stats were published by the NWMLS yesterday. Before we get into our monthly stats, here’s a quick look at their press release.
Northwest MLS brokers say home buyers are sprinting, but sellers are stalling
Home buyers are in “full sprint” mode while sellers are stalling, according to brokers from Northwest Multiple Listing Service. As a result, MLS members are juggling severe inventory shortages and multiple offers in many Seattle neighborhoods and beyond.
MLS figures for May show double-digit drops in inventory compared to a year ago and double-digit gains in both sales and prices. Commenting on the numbers, Northwest MLS director Dick Beeson said “The crush between the lack of inventory and desperate buyers may soon generate the next TV reality show! The stressed market is exhausting everyone in its path, with no relief in sight.”
…
J. Lennox Scott, chairman and CEO of John L. Scott, Inc. called 2015 “the best start ever for sales activity.” Citing MLS figures, he noted cumulative pending home sales in the four-county Puget Sound area for the first five months of the year are outpacing the previous record year of 2005. “This time,” he emphasized, “the housing market is built on a strong foundation of qualified buyers.”
You can definitely trust Lennox to know that it’s different this time. He has a great track record for predictions.
NWMLS monthly reports include an undisclosed and varying number of
sales from previous months in their pending and closed sales statistics.
Here’s your King County SFH summary, with the arrows to show whether the year-over-year direction of each indicator is favorable or unfavorable news for buyers and sellers (green = favorable, red = unfavorable):
| May 2015 | Number | MOM | YOY | Buyers | Sellers |
|---|---|---|---|---|---|
| Active Listings | 3,280 | +9.2% | -21.1% |  |
 |
| Closed Sales | 2,684 | +14.1% | +15.4% |  |
 |
| SAAS (?) | 1.21 | -11.5% | -20.6% |  |
 |
| Pending Sales | 3,447 | +1.1% | +2.9% |  |
 |
| Months of Supply | 1.22 | -4.3% | -31.6% |  |
 |
| Median Price* | $480,942 | +0.2% | +8.7% |  |
 |
Feel free to download the updated Seattle Bubble Spreadsheet, but keep in mind the caution above.
Unfortunately for buyers, there’s still no good news on supply. Inventory is pitiful and shows no glimmer of getting any better soon. With inventory as low as it is and interest rates still so low, I’m actually surprised home prices are only up six percent from a year ago.
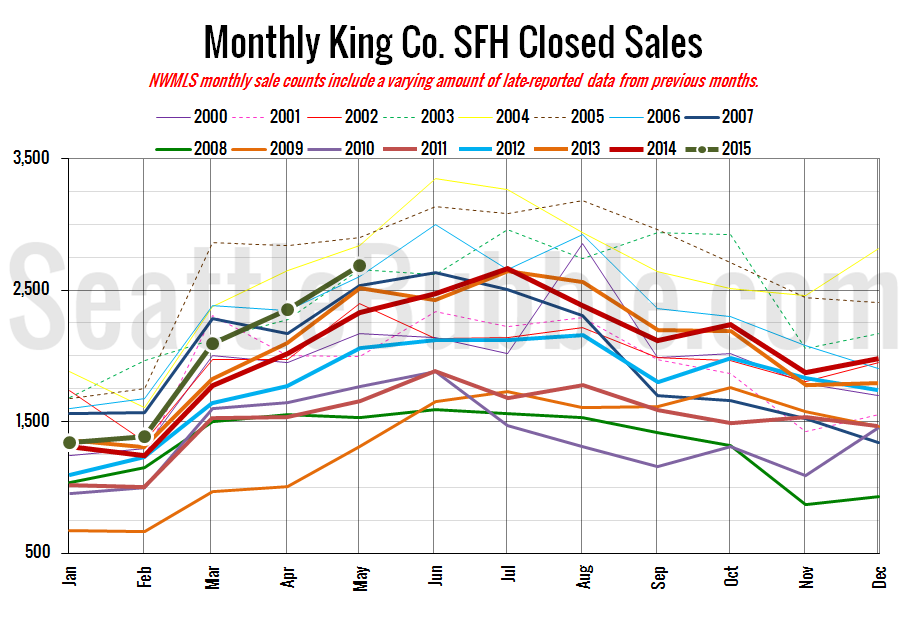
Here’s your closed sales yearly comparison chart:
Closed sales rose 14 percent from April to May. Last year they rose 15 percent over the same period. Only two years had more closed sales in May than this year: 2004 and 2005. Meanwhile, pending sales have hit an all-time high , but that is less meaningful since the NWMLS changed their definition of “pending” in July 2008.
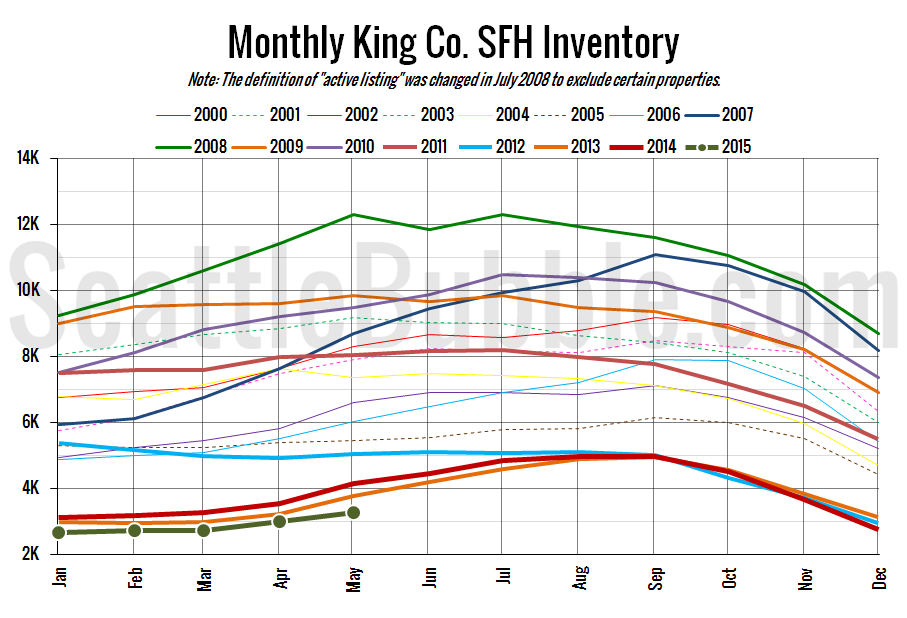
Here’s the graph of inventory with each year overlaid on the same chart.
Inventory did go up slightly from April to May, but still turned in the lowest ever recorded level for a May.Year-over-year inventory is still down double digits, off 21 percent from 2014. This is the largest year-over-year decrease in inventory in two years.
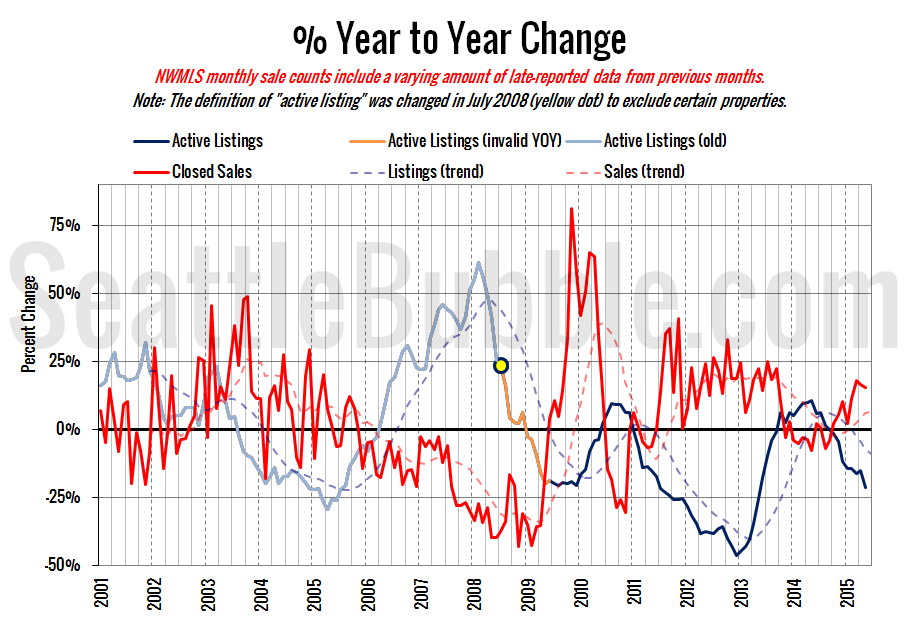
Here’s the supply/demand YOY graph. “Demand” in this chart is represented by closed sales, which have had a consistent definition throughout the decade (unlike pending sales from NWMLS).
The demand trend inched slightly back toward buyers’ favor in May, but the supply curve is going from bad to worse.
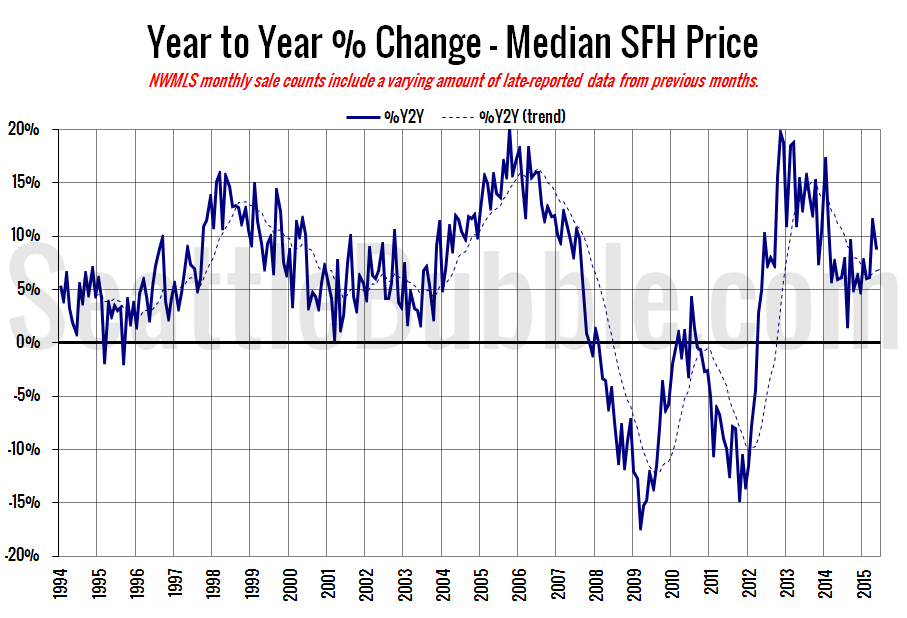
Here’s the median home price YOY change graph:
Once again I find myself surprised that this chart has fallen below double-digit territory.
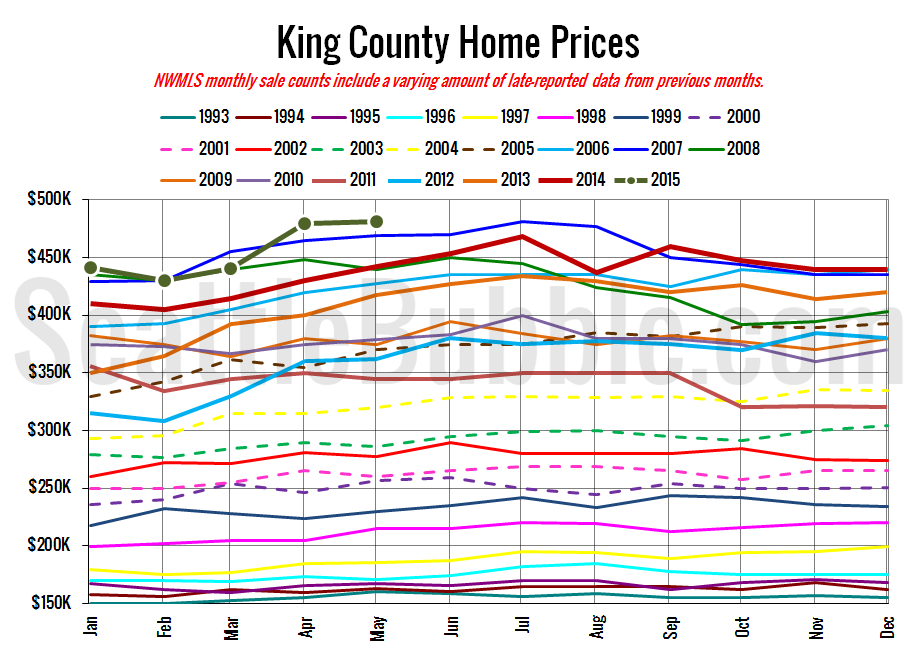
And lastly, here is the chart comparing King County SFH prices each month for every year back to 1994 (not adjusted for inflation).
The median home price inched up in May to a number comically close to the July 2007 peak. Literally less than sixty dollars below the nominal peak value reached nearly eight years ago.
May 2015: $480,942
July 2007: $481,000
Here’s this month’s article from the Seattle Times: Home-price boom: What $450K will buy you around Puget Sound
Check back Monday for the full reporting roundup.
