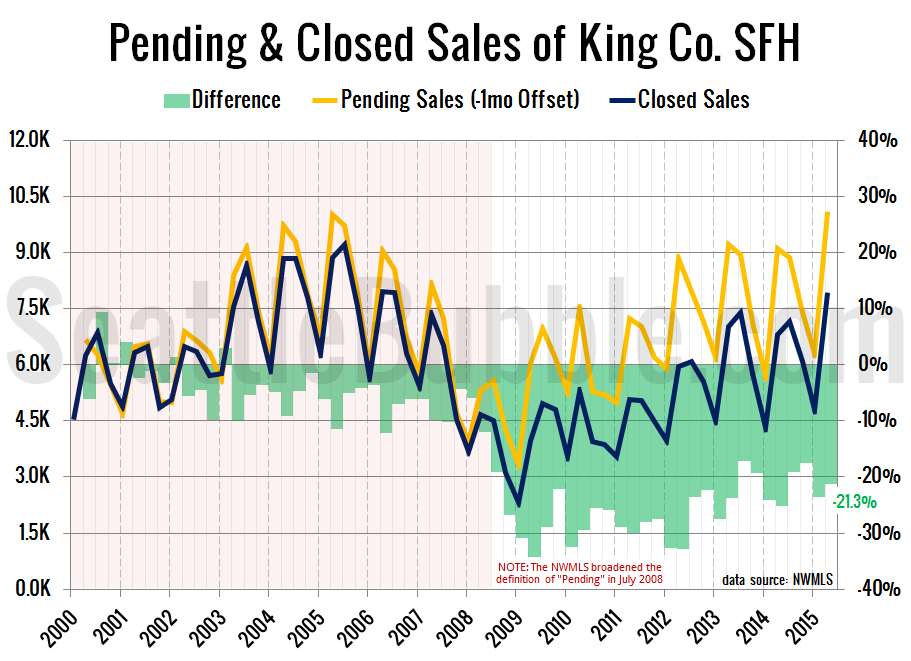
With another quarter fully in the books, let’s take a look a the latest data on pending sales volume versus closed sales volume.
For this series I roll the pending sales and closed sales data up by quarter, with pending sales offset by one month. In other words, the second quarter numbers below represent pending sales from March, April, and May and closed sales from April, May, and June.
After dropping in Q4 to a level near its lowest point since the NWMLS’s redefinition of “pending” in July 2008, the gap between pending sales and following month closed sales grew in Q1 and Q2. This is not surprising though, since typically the first and second quarter of the year see a slightly larger gap than the third and fourth quarters.
The fact that one in five pending sales don’t appear to be closing even in this ridiculously overheated market is the one silver lining for home buyers out there today. Even if you lost the bidding war on the “home of your dreams,” keep a close eye on the home because there’s a chance it might be back…
