Get access to the full spreadsheets used to make the charts in this and other posts, as well as a variety of additional insider benefits by becoming a member of Seattle Bubble.
September market stats were published by the NWMLS today. Before we get into our monthly stats, here’s a quick look at their press release.
Housing market slowdown expected
But prices in most areas are still risingScarce inventory, new rules for mortgage closings and affordability concerns will likely slow home sales around Western Washington during the remaining months of 2015 and into early 2016, according to spokespersons from Northwest Multiple Listing Service.
The latest statistics from the MLS show a double-digit drop in inventory, a double-digit jump in closed sales, and a near double-digit increase in prices from a year ago, prompting one industry leader to say the trends aren’t sustainable. “We simply can’t sustain double-digit increases in sales when inventory levels continue to drop every month,” remarked OB Jacobi, president of Windermere Real Estate. “We’re on the cusp of a housing market slowdown,” he predicts.
It’s very interesting to see home salespeople actually warning about a housing market slowdown. Apparently they learned at least something from the 2000s bubble and subsequent bust.
NWMLS monthly reports include an undisclosed and varying number of
sales from previous months in their pending and closed sales statistics.
Here’s your King County SFH summary, with the arrows to show whether the year-over-year direction of each indicator is favorable or unfavorable news for buyers and sellers (green = favorable, red = unfavorable):
| September 2015 | Number | MOM | YOY | Buyers | Sellers |
|---|---|---|---|---|---|
| Active Listings | 3,403 | -2.5% | -31.4% |  |
 |
| Closed Sales | 2,364 | -8.2% | =11.9% |  |
 |
| SAAS (?) | 1.09 | -13.3% | -18.0% |  |
 |
| Pending Sales | 2,753 | -7.3% | +5.2% |  |
 |
| Months of Supply | 1.44 | +6.2% | -38.7% |  |
 |
| Median Price* | $490,250 | -1.9% | +6.6% |  |
 |
With record-low inventory and one of the strongest years for closed sales, it’s frankly shocking that prices are “only” up 6.6 percent from a year ago. I think we may be at some kind of saturation point with respect to home prices. Since we don’t have ridiculous financing (e.g. 80/20, NINJA, negative-amorization, interest-only, etc.), home prices this time around are limited by what people can actually afford to pay.
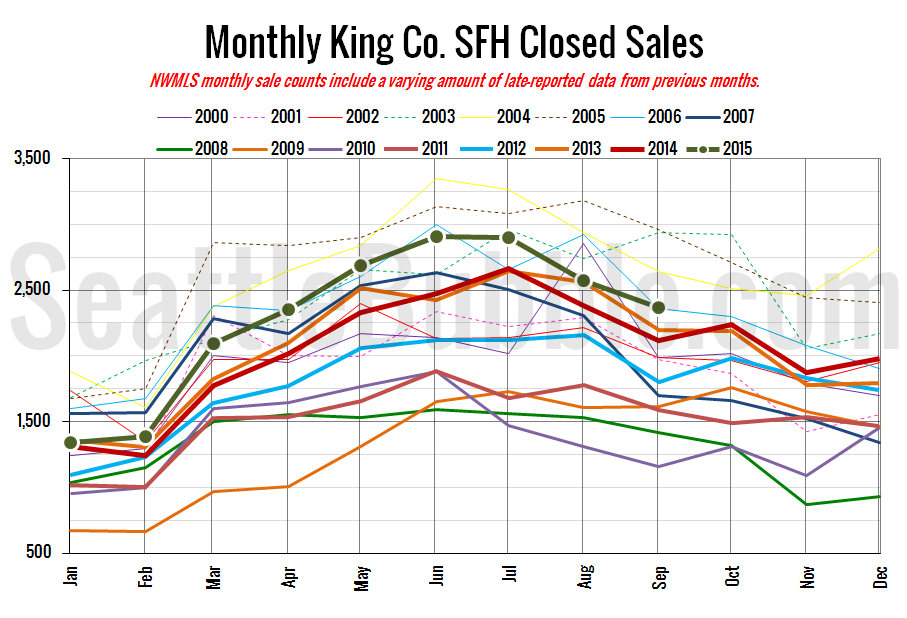
Here’s your closed sales yearly comparison chart:
Closed sales fell 8 percent from August to September. Last year they fell about 11 percent over the same period. The prior ten years (2004-2013) saw an average 12 percent decline in closed sales between August and September, so this year’s slowdown is slightly slower than typical. Meanwhile year-over-year closed sales increased slightly to the highest level in the last three months.
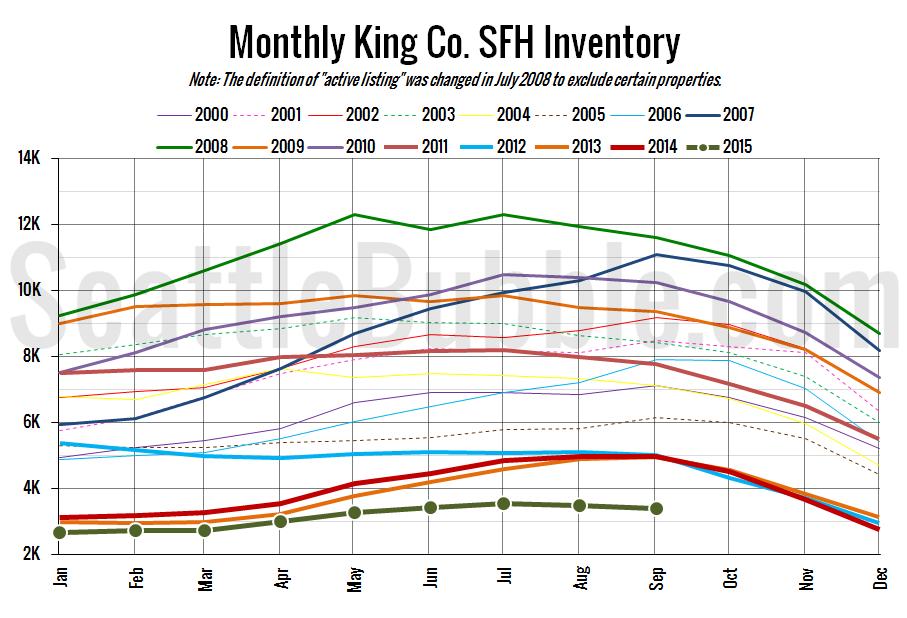
Here’s the graph of inventory with each year overlaid on the same chart.
Inventory fell again from August to September, while the year-over-year number fell further into the red.
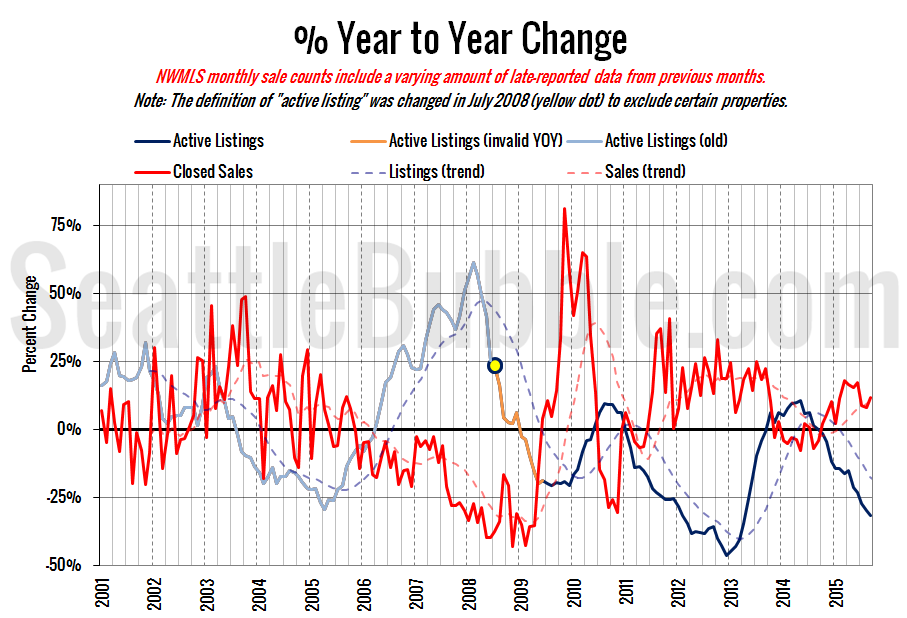
Here’s the supply/demand YOY graph. “Demand” in this chart is represented by closed sales, which have had a consistent definition throughout the decade (unlike pending sales from NWMLS).
Everything in this chart is still in sellers’ favor, and both lines moved even further into sellers’ market territory in September.
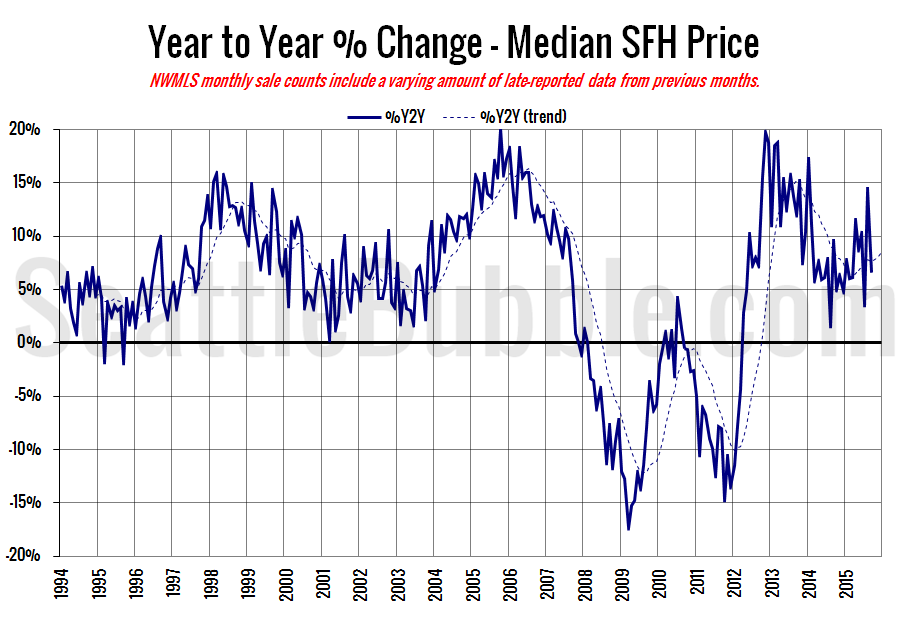
Here’s the median home price YOY change graph:
Another big swing in this chart from +14.4 percent in August to +6.6 percent in September.
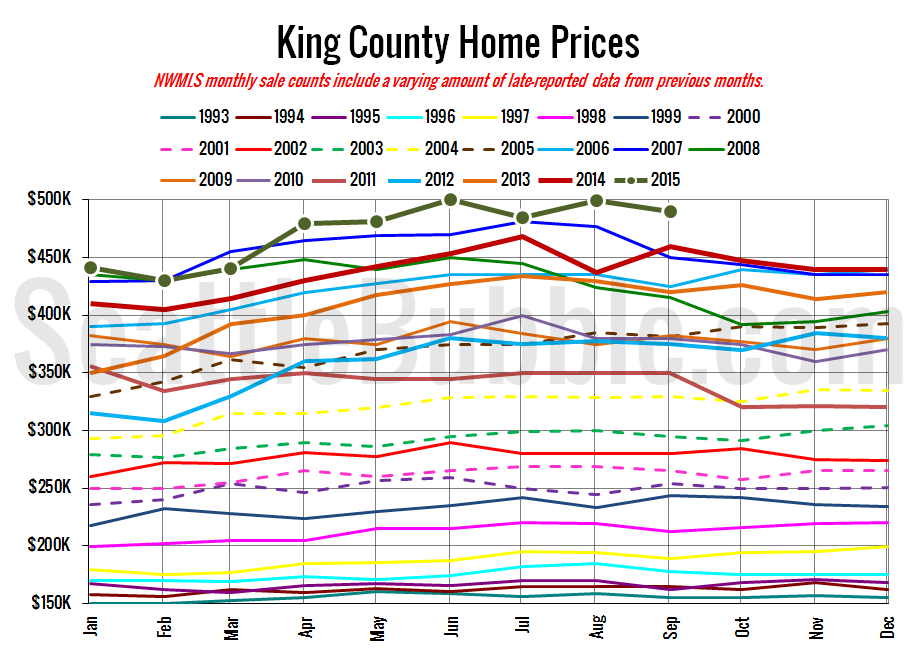
And lastly, here is the chart comparing King County SFH prices each month for every year back to 1994 (not adjusted for inflation).
The median home price has been bouncing around in the $480,000 to $500,000 range since April.
September 2015: $490,250
July 2007: $481,000 (pre-2015 high)
Here’s this month’s article from the Seattle Times: Local home sales slow, median prices edge lower in September
Check back tomorrow for the full reporting roundup.
