Get access to the full spreadsheets used to make the charts in this and other posts, as well as a variety of additional insider benefits by becoming a member of Seattle Bubble.
January market stats were published by the NWMLS yesterday. Before we get into our monthly stats, here’s a quick look at their press release.
Lack of inventory “a game changer” for home buyers
Depleted inventory is contributing to “overwhelming” traffic at open houses, shifts in strategies for both buyers and sellers, and escalating prices, according to officials with the Northwest Multiple Listing Service.Dick Beeson, a former chairman of the MLS board, said the lack of inventory in almost every county is, “without question, a 2016 game changer.”
We have been in an extremely low-inventory market for going on three years now. How is a continuation of a years-long trend “a game changer”? Ridiculous hyperbole.
NWMLS monthly reports include an undisclosed and varying number of
sales from previous months in their pending and closed sales statistics.
Here’s your King County SFH summary, with the arrows to show whether the year-over-year direction of each indicator is favorable or unfavorable news for buyers and sellers (green = favorable, red = unfavorable):
| January 2016 | Number | MOM | YOY | Buyers | Sellers |
|---|---|---|---|---|---|
| Active Listings | 1,934 | +9.6% | -27.9% |  |
 |
| Closed Sales | 1,314 | -36.2% | -1.9% |  |
 |
| SAAS (?) | 1.02 | +1.8% | -0.3% |  |
 |
| Pending Sales | 1,812 | +22.8% | -15.3% |  |
 |
| Months of Supply | 1.47 | +71.7% | -26.4% |  |
 |
| Median Price* | $490,970 | -3.4% | +11.2% |  |
 |
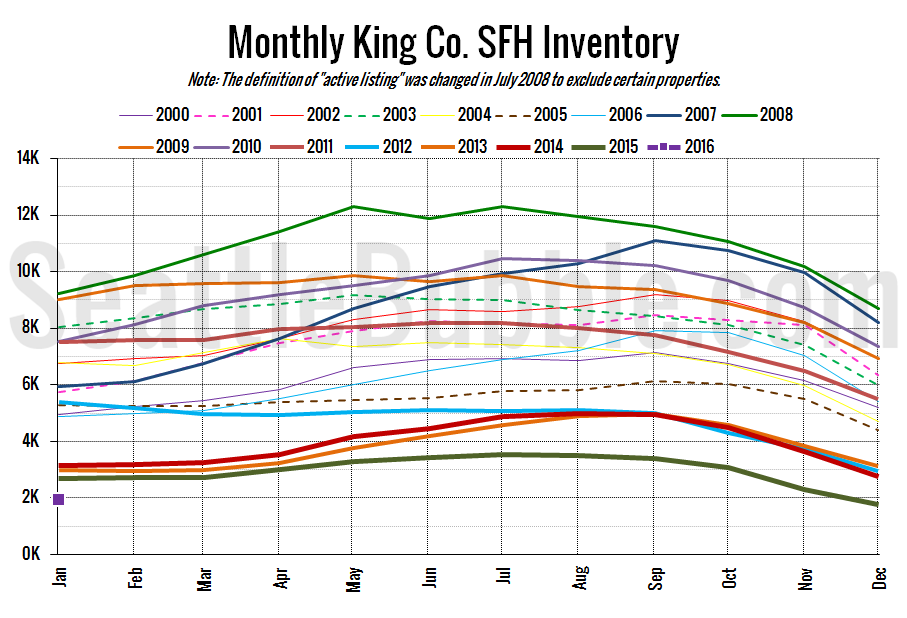
After setting new all-time low inventory levels in November and December, we actually saw a decent increase in January. Last month was still the lowest inventory level ever seen in a January, but at least unlike last year, we did see an uptick from December.
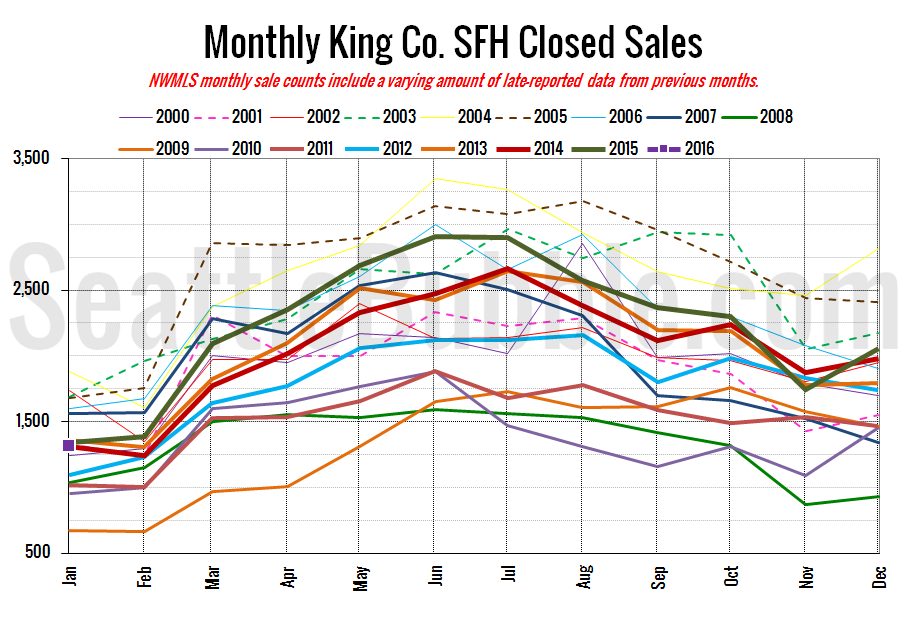
Here’s your closed sales yearly comparison chart:
Closed sales fell off dramatically from the month earlier, and notched their second year-over-year decline in the last three months. Interestingly the December to January dropoff in closed sales was the largest month-over-month decrease we have seen in this statistics since January 2005. Meanwhile, the 15 percent year-over-year decline in pending sales is the largest dropoff we have seen since April 2011.
There was definitely a softening in the sales stats in January. It will be interesting to see if it is a blip or the start of a trend.
Here’s the graph of inventory with each year overlaid on the same chart.
Total inventory is at its lowest January level by a longshot. New listings are also still depressed, so it’s doubtful we’ll see this number climb much in the next few months unless the January slowdown in sales picks up steam over the next few months.
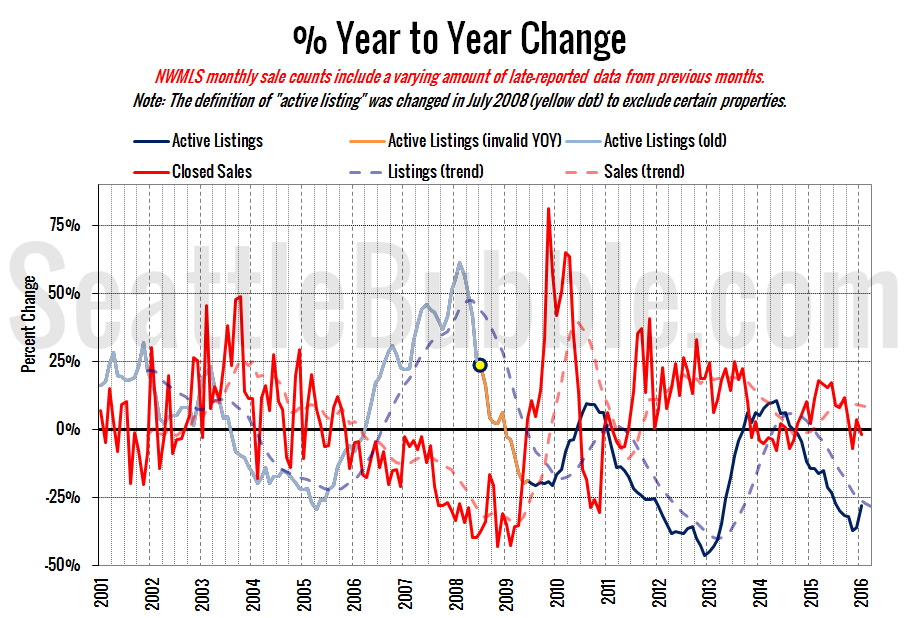
Here’s the supply/demand YOY graph. “Demand” in this chart is represented by closed sales, which have had a consistent definition throughout the decade (unlike pending sales from NWMLS).
The red demand line went back into buyer’s territory again in January. The blue supply line is still deep in seller’s market territory, but the 8.2-point increase from December to January was the largest bump since May 2013.
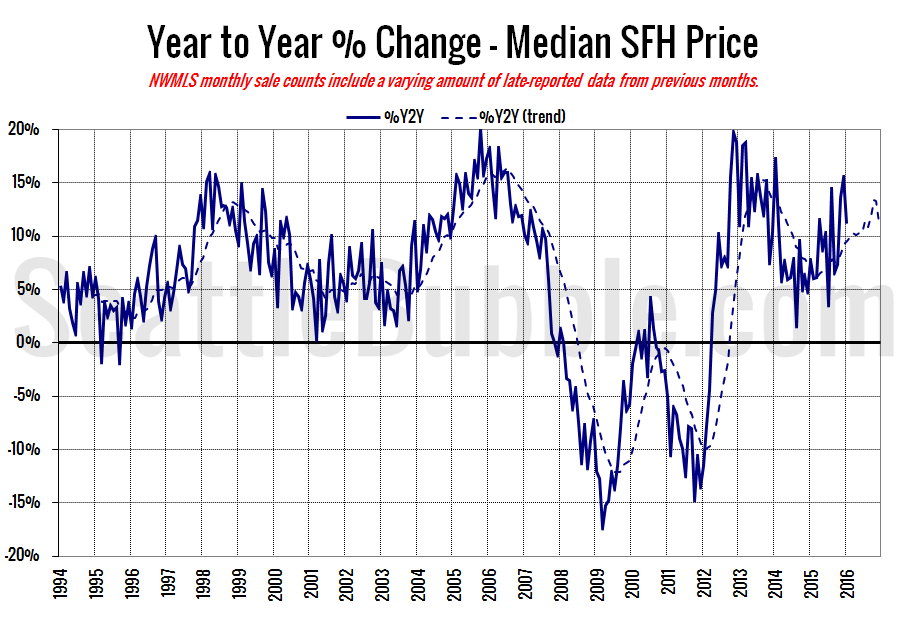
Here’s the median home price YOY change graph:
Year-over-year price growth decreased from +15.5 percent in December to +11.2 percent in January.
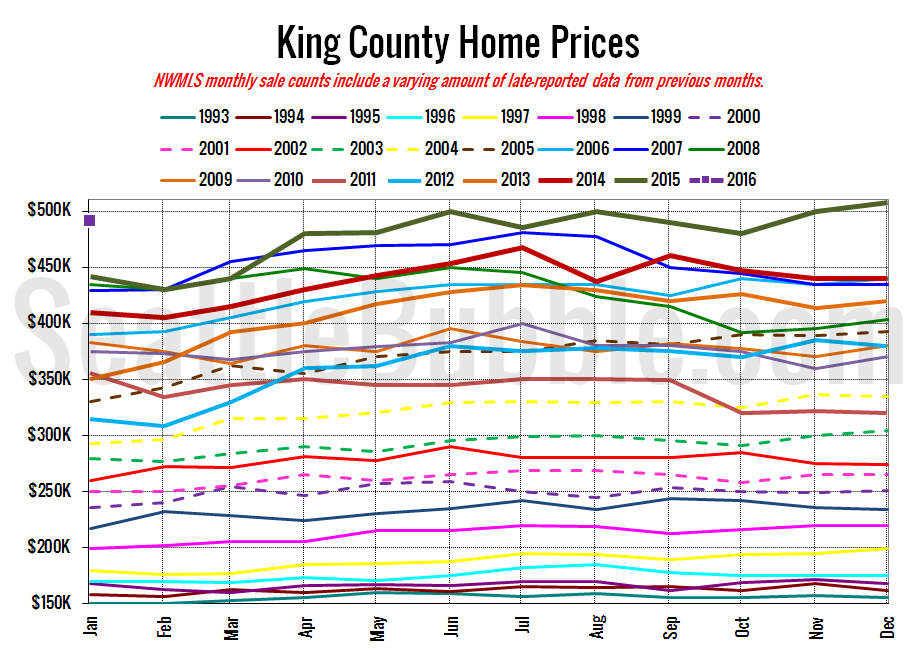
And lastly, here is the chart comparing King County SFH prices each month for every year back to 1994 (not adjusted for inflation).
The median home price dropped back into that $480,000 to $500,000 range it was in between April and November of last year.
January 2016: $490,970
July 2007: $481,000 (pre-2015 high)
Here’s this month’s article from the Seattle Times: Shortage of homes for sale pushes prices upward, buyers outward
Check back on Monday for the full reporting roundup.
